Source: http://davidstockmanscontracorner.com/take-cover-wall-street-is-breaking-out-the-bubblies/
Let’s see. Google’s record market cap gain on Friday was actually a squeaker. At $66.9 billion it easily passed in one day the entire $50 billion market cap of Caterpillar’s global heavy machinery and engine franchise built up over a century. But only by a hair did it best Cisco’s $66.0 billion gain on April 17, 2000.
But perish the thought that Friday’s fireworks had any resemblance to the shooting star act of Cisco and hundreds of other tech high-flyers 15 years ago or the epic bloodbath that commenced shortly thereafter.
Then again, something was going on with the GOOG beyond the fundamentals. Notwithstanding that Google is one of the most fantastic value creating enterprises on the planet, there was nothing in Friday’s earnings report for Q2 that warranted a 16% re-rating of its market cap.
Indeed, the $345 million or 9.6% gain in net income from the prior quarter was not much of a talisman. Fully 75% of the gain was accounted for by a lower tax rate (from 22.1% to 20.7%) and a cutback of what had been ballooning G&A expenses (from 8.8% of sales to 8.2%). Aside from these benefits at the margins of what is a $70 billion sales machine, net income grew at an unremarkable 2.9% over prior quarter and 7.4% over prior year.
Yet Friday’s re-rating was considerable on a valuation basis. GOOG is entering corporate middle age as it presses upon the law of large numbers, and even with the Q2 uplift its financials clearly show its age. During the three and one-half years since CY 2011, Google’s growth rate for both sales and net income has slowed to 15% per annum.
Consequently, it is hard to see why its LTM net income of $15.1 billion was re-rated from 26X to 31X in less than two hours’ trading. That’s especially the case because 90% of GOOG’s revenues are from advertising, and even the digital ad portion of that space is slowing and getting saturated by GOOG’s preponderant market share.
To wit, the global market for digital advertising outside of China (which lies unavailable behind red-coded firewalls) is projected at $140 billion for 2015. This means that GOOG’s projected digital ad sales of $65 billion this year will compute to a 46% worldwide market share.
Moreover, digital ads already account for 35% of the total worldwide ex-China advertising spend. So the easy digital share gains have been had and no one—–not even the madcap money printers running the central banks—-has eliminated either the business cycle or the cyclicality of ad spending.
Stated differently, GOOG is hurtling fast toward single-digit growth land. It has not invented a new product that’s on a 100X or 1000X market penetration ramp. Instead, its captured an impressive share of the old-line advertising spend that amounts to $190 billion in the US and $500 billion worldwide ex-China, and which will head south as it always does during the very next recession.
Its probably even worse. GOOG’s estimated 2015 advertising revenues of $65 billion compares to about $44 billion in 2012 before the tech sector was ignited by a tsunami of VC funding and soaring pre-IPO valuations. So some considerable portion of that $21 billion revenue gain may well represent burn-rate money from start-up customers that most definitely will not be around after the next day of reckoning in Silicon Valley.
Never mind. When all else fails, there is nothing like a spree of PE multiple re-ratings to keep the Wall Street party going a few additional months.
But don’t call them re-ratings. After all, this time is different because nothing which happened during the last two Wall Street crashes is remotely relevant to today’s awesome outlook. For example, here’s a real yucker from Morgan Stanley’s ultra-bullish chief US equity strategist, Adam Parker. Unlike during the last tech-wreck, he avers, we are dealing with real companies with substantial sales and earnings, not dotcom eyeball candy:
Today’s tech companies bear little resemblance to the makeshift operations that quickly burned through cash more than a decade ago, says Adam Parker, Morgan Stanley & Co.’s Chief US Equity Strategist. In 1999, fewer than half of tech companies were profitable. With some notable exceptions, around 90% of tech firms now have positive operating margins.
Undoubtedly, Mr. Parker was still guzzling beer in his dorm room during the last tech crash, but that doesn’t excuse his abysmal ignorance of the historical facts. In the Great Deformation I tracked the fate of the dozen big cap tech companies before and after the dotcom crash. These included Cisco, Dell, Intel, Microsoft, Lucent Technologies, Juniper Networks, Hewlett-Packard, Nortel, WorldCom and Global Crossing—–with General Electric and AIG thrown in for spice.
Needless to say, these weren’t “makeshift operations”. Among them they had posted in excess of $300 billion in sales and $50 billion in net income at the turn of the century.
But here’s what happened. During the time between Greenspan’s infamous “irrational exuberance” speech in December 1996 and the March 2000 dotcom peak, the aggregate market cap of these dozen high flyers soared from $600 billion to $3.8 trillion.Notwithstanding respectable rates of sales and earnings growth, operating performance of these big cap tech giants did not remotely justify a 6X gain in market cap during this 39 month period.
For once Greenspan had been right. It was irrational exuberance on steroids——a proposition validated in spades by subsequent events. To wit, during the next 18 months a stunning $2.7 trillion of this market cap vanished and never returned. In fact, by 2012 four of these companies had disappeared and the market cap of those which remained was just $850 billion or 22% of the peak level.
But here’s the stunner. The market value gain of this dozen highflyers between Greenspan’s irrational exuberance mutterings and the end of 2012 amounted to the grand sum of 2.5% per annum.
So beware of the re-rating game. It works in both directions, and violently so when it goes into reverse. And in any event, young Mr. Parker should flunk freshman economics for missing the $3 trillion elephant in the room. Makeshift operations, indeed.
Nor did history put a crimp in the re-ratings game this time around. On Friday, Wall Street sounded just like February 2000:
And at least five brokerages — J.P. Morgan, Bernstein Research, Nomura Research, Jefferies and Evercore — think Google’s stock will can and will go still higher. After Google reported a sharp rise in earnings and sales that trumped Wall Street’s expectations, they all raised their 12-month targets on the company’s stock Friday morning to $800. At that price, Google’s market cap would catapult above the half-trillion-dollar mark to $547 billion, making Google only the second company, along with Apple AAPL, +0.86% to be valued above the half-trillion-dollar threshold. Apple is currently trading at a $740 billion valuation.
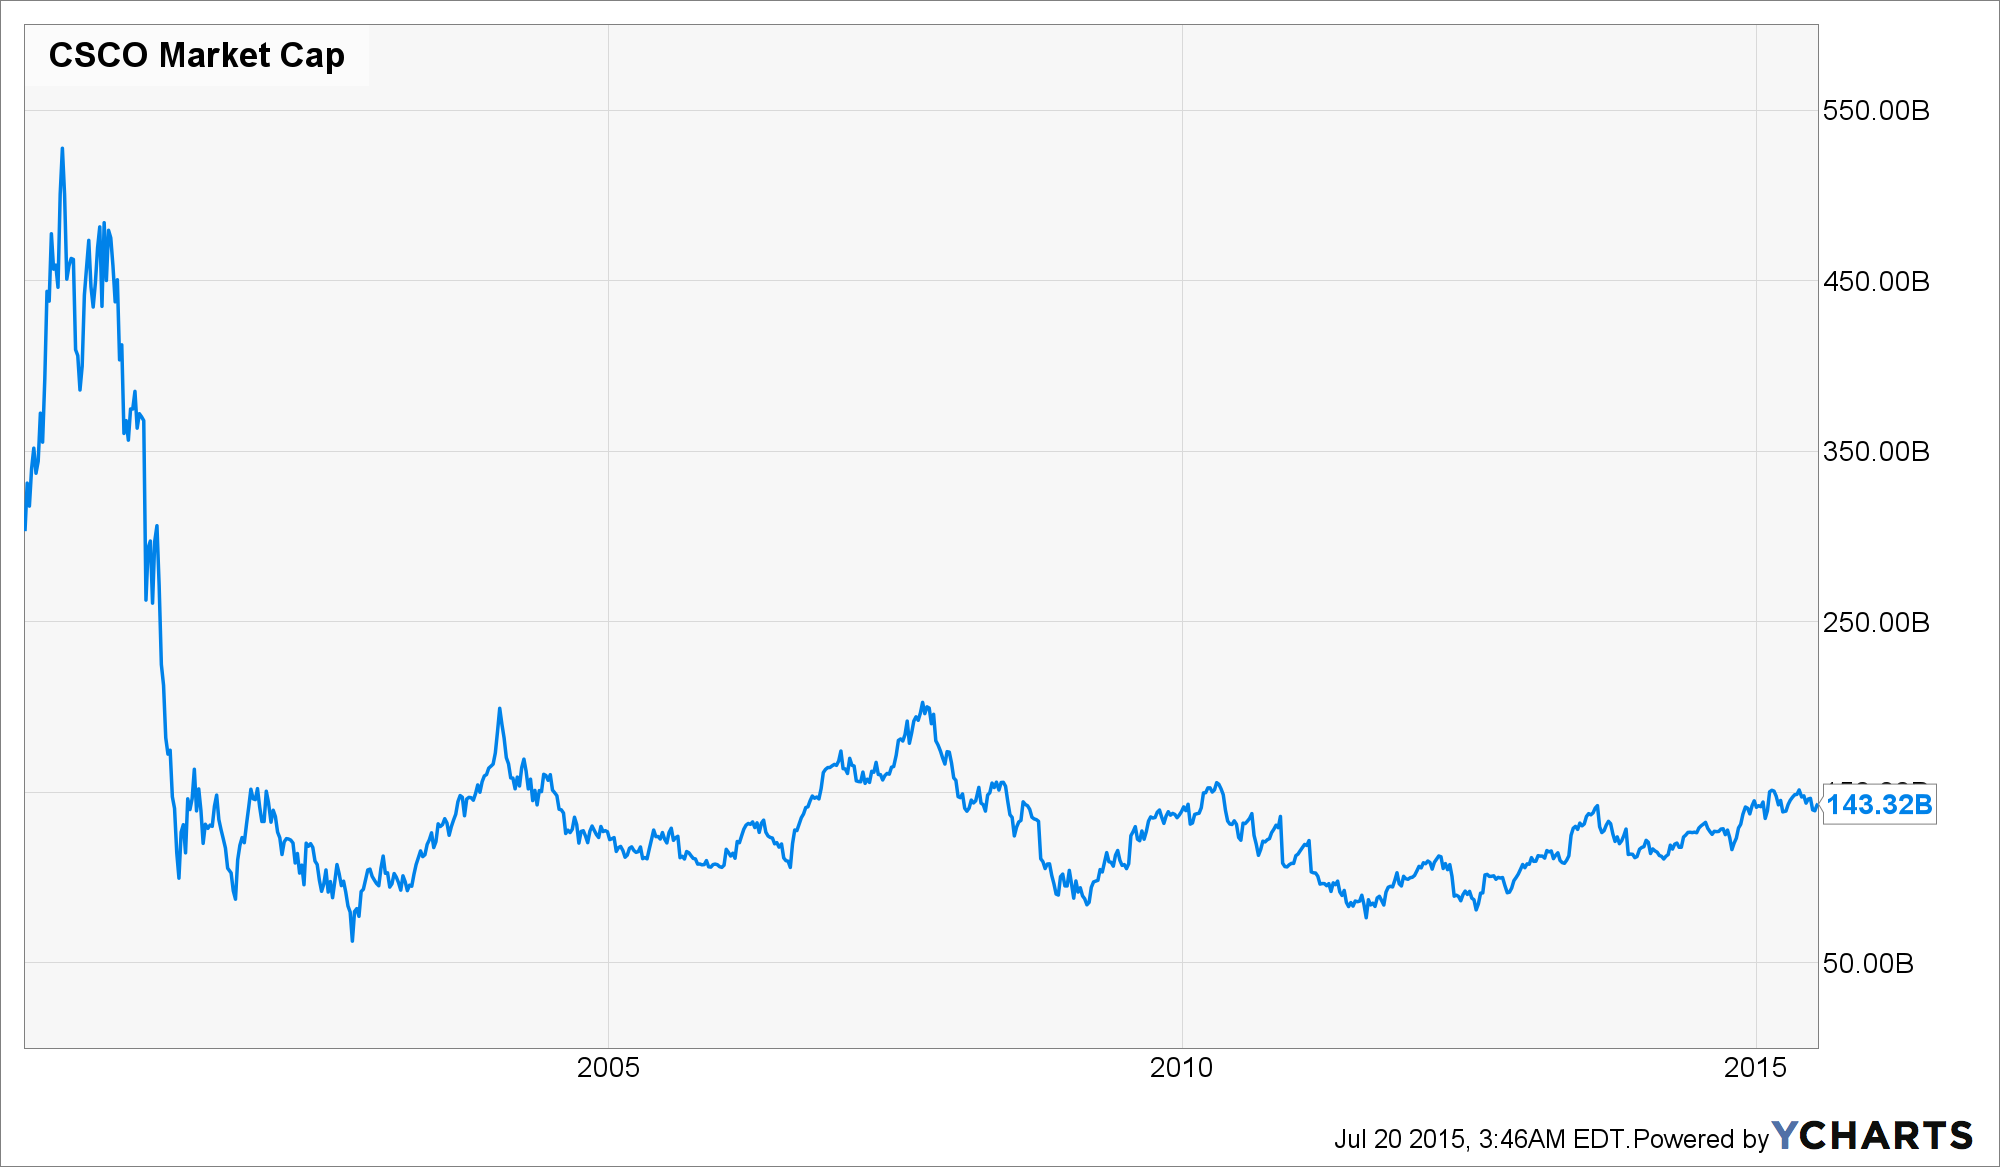
Indeed, the Cisco story alone is dispositive. At the time of its $66 billion one-day surge, Cisco was posting about $15 billion of net sales and $2.5 billion of net income. Not at all makeshift.

CSCO Market Cap data by YCharts
Needless to say, that didn’t stop its $555 billion peak market cap from being ionized during the tech wreck. By October 2002, $475 billion or 85% of that total had disappeared, and 15 years later Cisco’s market cap is still only 25% of its once and glorious top.
Yet this is not because CSCO slide down the tubes as an operating company in the interim. In fact, its current $49 billion of LTM sales are triple its year 2000 level and net income of $9 billion is nearly 4X higher than it was then.
In short, even as Cisco did become “all things digital” and a dominant behemoth in its server, router and internet equipment space, it got “re-rated” downward with a vengeance as it became clear that it was not Jack’s financial beanstalk after all. That is, its results kept on growing, but just not to the sky.

CSCO Net Income (TTM) data by YCharts
In the Cisco case, the downward rerating after the dotcom crash was considerable, to say the least. At the time of the April 2000 crash it was trading a 220X LTM reported earnings. That compares to 13X today.
And that gets to the real truth about the Wall Street bubblies which were flowing last Friday. Morgan Stanley’s chief equity strategist, like the rest of the sell-side stock peddlers, has it exactly upside down; and the proof of the pudding in this instance lies is in Morgan Stanley’s own “New Tech” index of 16 high flyers of the present era.
This charmed circle includes Google, Amazon, Baidu, Facebook, Saleforce.com, Netflix, Pandora, Tesla, LinkedIn, ServiceNow, Splunk, Workday, Ylep, Priceline, QLIK Technologies and Yandex. Taken altogether, their market cap clocked in at $1.3 trillion on Friday. That compares to just $21 billion of LTM net income for the entire index combined.
The talking heads, of course, would urge not to be troubled. After all, what’s a 61X trailing PE among today’s leading tech growth companies?
As it happens, quite a bit. When you take GOOG’s middle-aged profits machine out of the mix, you get something altogether more frisky. Namely, a collective market cap of $840 billion for the other 15 names in the Morgan Stanley index and LTM net income of exactly $6.0 billion.
As we said at the top—-let’s see. That’s a PE multiple of 140X. That’s February 2000 all over again.
Take cover. The Wall Street bubblies are back!


