- Protectionism is on the increase among developed nations
- The benefits of free-trade have been most evident in developing countries
- Short-term effects on financial markets may be reversed in the long run
- The net impact on global growth will be negative
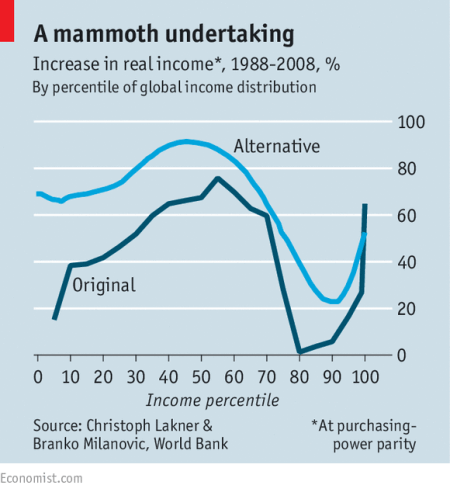
The success of free-trade and globalisation has been a boon for less developed countries but, to judge by the behaviour of the developed world electorate of late, this has been at the expense of the poorer and less well educated peoples of the developed nations. Income inequality in the west has been a focus of considerable debate among economists. The “Elephant Chart” below being but one personification of this trend:-

Source: Economist, World Bank
If the graph looks familiar it’s because I last discussed this topic back in November 2016 in – Protectionism: which countries have room for fiscal expansion? This is what I said about the chart at that time:-
What this chart reveals is that people earning between the 70th and 90th percentile have seen considerably less increase in income relative to their poor (and richer) peers. I imagine a similar chart up-dated to 2016 will show an even more pronounced decline in the fortunes of the lower paid workers of G7.
The unforeseen consequence to this incredible achievement – bringing so many of the world’s poor out of absolute poverty – has been to alienate many of the developed world’s poorer paid citizens. They have borne the brunt of globalisation without participating in much, if any, of the benefit.
It can be argued that this chart is not a fair representation of the reality in the west. This excellent video by Johan Norberg – Dead Wrong – The Elephant Graph – makes some important observations but, as a portfolio manager, friend of mine reminded me recently, when considering human action one should not focus on absolute change in economic circumstances, but relative change. What did he I mean by this? Well, let’s take income inequality. The rich are getting richer and the poor are…getting richer less quickly.
In the dismal science, as Carlyle once dubbed economics, we often take a half-empty view of the world. Take real average income. Since 2008 people have become worse-off as the chart below for the UK shows:-

Source: Economicshelp.org
However, in the long-run we have become better-off for generations. What really drives prosperity, by which I mean our quality of life, is productivity gains: our ability to harness technology to improve the production of goods and services.
Financial markets are said to be driven by fear and greed. Society in general is also driven by these factors but there is an additional driver: envy. Any politician who ignores the power of envy, inevitably truncates his or her career.
The gauntlet was thrown down recently by the new US administration: their focus was on those countries with trade surpluses with the US. Accusations of trade and currency manipulation play well to the disenfranchised American voter.
Well before the arrival of the new US President, however, a degree of rebalancing had already begun to occur when China adopted policies to increase domestic consumption back in 2012. A recent white paper entitled – Is the Global Economy Rebalancing? By Focus Economics – looks at the three countries with the largest persistent current account surpluses: China, Germany and Japan. As they comment in their introduction, a current account surplus may be derived by many different means:-
Decades of conflicting perspectives over the causes and effects of global trade imbalances have been thrust back into the spotlight in recent months by Donald Trump’s brazen criticism of almost every country with a significant current account surplus with the U.S. His controversial accusation that big exporter countries are deliberately weakening their currencies to gain a competitive advantage taps into an issue that has perplexed and divided economists and policymakers ever since the mid-1990s. At that time, countries such as the U.S. were starting to build up large current account deficits, while others such as China, Germany and Japan were accumulating large surpluses.
Put simply, a country’s current account balance measures the difference between how much it spends and makes abroad. Trade in goods usually—but not always—accounts for most of the current account, while the other components are trade in services, income from foreign investment and employment (known as ‘primary income’), and transfer payments such as foreign aid and remittances (known as ‘secondary income’).
A current account surplus or deficit is not necessarily in and of itself a good or bad thing, since a number of considerations must be factored in—for example, in the case of deficit countries, whether they make a return on their investments that exceeds the costs of funding them. A large current account surplus can be considered a desirable sign of an efficient and competitive economy if it comprises a positive trade balance generated by market forces. And yet such competitiveness can also be falsely created to an extent by policy decisions (e.g. a deliberate currency weakening), or may alternatively be a sign of overly weak domestic demand in a highly productive country. Therein lies the crux of the controversy, or at least one of many.
Global imbalances were a critically important contributing factor to the financial crisis, although they did not in themselves cause it. Even if the precise nature of that connection has sparked different interpretations, there is at least more or less agreement on the fundamentals of the part played by trade relations between the U.S. and China, the two countries traditionally responsible for the lion’s share of global imbalances. Credit-fueled growth in the U.S. encouraged consumers to spend more, including on products originating in China, thereby further increasing the U.S. trade deficit with China and prompting China to “recycle” the dollars gained by buying U.S. assets (mostly Treasury notes). This, in turn, helped to keep U.S. interest rates low, encouraging ever greater bank lending, which pushed up housing prices, caused a subprime mortgage crisis and ultimately ended in a nasty deleveraging process.
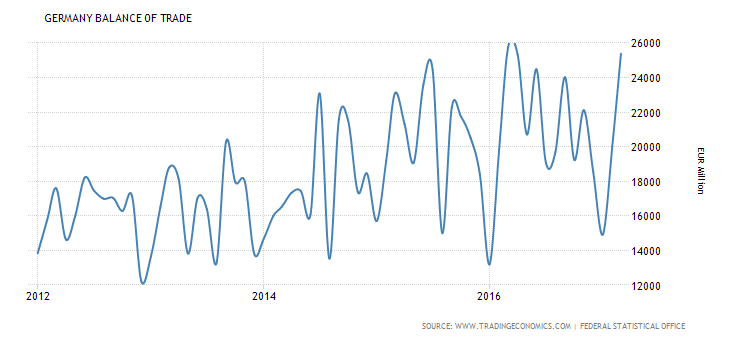
Services and investment balances can be difficult to measure accurately; trade data is easier to calculate. Here are the three current account surplus countries in terms of their trade balances:-

Source: Trading Economics, Chinese General Administration of Customs
Interestingly, China’s trade balance has declined despite the recent devaluation in the value of the Yuan versus the US$.

Source: Trading Economics, German Federal Statistics Office
The relative weakness of the Euro seems to have underpinned German exports. On this basis, the weakening of the Euro, resulting from the Brexit vote, has been an economic boon!

Source: Trading Economics, Japanese Ministry of Finance
The Abenomics policy of the three arrows whilst it has succeeded in weakening the value of the Yen, has done little to stem its steadily deteriorating trade balance. The Yen has risen ever since the ending of Bretton Woods, it behoves Japanese companies to invest aboard. The relative strength of the current account is the result of Japanese investment abroad.
Trade data is not without its flaws, even in a brand dominated business such as automobiles the origin of manufacture can turn out to be less obvious than it might at first appear. According to the Kogod – Made in America Auto Index 2016 – at 81% the Honda Accord ranks fifth out of all automobiles, in terms of the absolute percentage of an entire vehicle which is built in the USA, well above the level of many Ford and General Motors vehicles.
Conclusions and Investment Opportunities
The financial markets will react differently in each country to the headwinds of de-globalisation and the rise of protectionism. The US, however, presents an opportunity to examine the outcome for a largest economy in the world.
The US currency’s initial reaction to the Trump election win was a significant rise. The US$ Index rallied from 97.34 on the eve of the election to test 103.81 at the beginning of January. Since then, as the absolute power, or lack thereof, of the new president has become apparent, the US$ Index has retraced the entire move. Protectionism on the basis of this analysis is likely to be UD$ positive. In the long run protectionist policies act as a drag on economic growth. The USA has the largest absolute trade deficit. Lower global economic growth will either lead to a rise in the US trade deficit or a strengthening of the US$, or, perhaps, a combination of the two.
Interest rates and bonds may be less affected by the strength of the US currency in a protectionist scenario, but domestic wage inflation is likely to increase in the medium term, especially if border controls are tightened further, closing off the flow of immigrant workers.
US stocks should initially benefit from the reduction in competition derived from a protectionist agenda but in the process the long run competitiveness of these firms will be undermined. The continual breaching to new highs which has been evident in the S&P 500 (and recently, the Nasdaq) is at least partially due to expectation of the agenda of the new administration. These policies include the lowering of corporation tax rates (from 35% to 15%) to bring them in line with Germany, infrastructure spending (in the order of $1trln) and protectionist pressure to “Buy American, Hire American”. Short term the market is still rising but valuations are becoming stretched by many metrics, as I said recently in Trumped or Stumped? The tax cut, the debt ceiling and riding the gravy train:-


