- US bond yields have risen from historic lows, they should rise further, they may not
- The Federal Reserve is beginning to reduce its balance sheet other CBs continue QE
- US bonds may still be a safe haven but a hawkish Fed makes short duration vulnerable
- Short dated UK Gilts make be a safe place to hide, come the correction in stocks
US Bonds
I used to think if there was reincarnation, I wanted to come back as the president or the pope or a .400 baseball hitter. But now I want to come back as the bond market. You can intimidate everybody – James Carville 1993
Back in the May 1981 US official interest rates hit 20% for the third time in 14 months, the yield on US 10yr Treasury Bond yields lagged somewhat and only reached their zenith in September of that year, at 15.82%. In those days the 30yr Bond was the global bellwether for fixed income securities; its yield high was only 15.20%, the US yield curve was inverted and America languished in the depths of a deep recession.
More than a decade later in 1993 James Carville, then advisor to President Bill Clinton, was still in awe of the power of the bond market. But is that still the case today? Back then, inflation was the genie which had escaped from the bottle with the demise of the Bretton Woods agreement. Meanwhile, Paul Volker, then Chairman of the Federal Reserve was putting into practice what William McChesney Martin, one of his predecessors, had only talked about, namely taking away the punch bowl. Here, for those who are unfamiliar with the speech, is an extract; it was delivered, by Martin, to the New York Bankers Association on 19th October 1955:-
If we fail to apply the brakes sufficiently and in time, of course, we shall go over the cliff. If businessmen, bankers, your contemporaries in the business and financial world, stay on the sidelines, concerned only with making profits, letting the Government bear all of the responsibility and the burden of guidance of the economy, we shall surely fail. … In the field of monetary and credit policy, precautionary action to prevent inflationary excesses is bound to have some onerous effects–if it did not it would be ineffective and futile. Those who have the task of making such policy don’t expect you to applaud. The Federal Reserve, as one writer put it, after the recent increase in the discount rate, is in the position of the chaperone who has ordered the punch bowl removed just when the party was really warming up.
Back in the October 1955 the Discount rate was 2.30% and the 10yr yield was 2.88%. The economy had just emerged from a recession and would not embark on its next downturn until mid-1957.
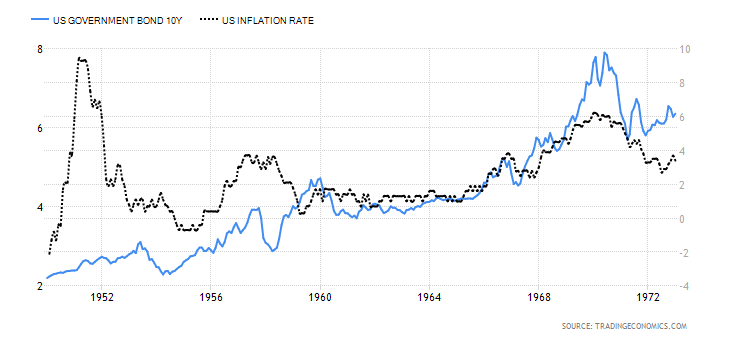
Today the US yield curve is also unusually flat, especially by comparison with the inflationary era of the 1970’s, 1980’s and 1990’s. In some ways, however, (barring the inflationary blip in 1951-52) it looks similar to the 1950’s. Here is a chart showing the 10yr yield (blue – LHS) and US inflation (dotted – RHS):-

Source: Trading Economics
I believe that in order to protect the asset markets (by which I mean, principally, stocks and real estate) the Federal Reserve (charged as it is with the twin, but not mutually exclusive, objectives of full-employment and stable prices) may decide to focus on economic growth and domestic harmony at the expense of a modicum of, above target, inflation. When Fed Chairman, Martin, talked of removing the punch bowl back in 1955, inflation had already subsided from nearly 10% – mild deflation was actually working its way through the US economy.
Central Bank balance sheets
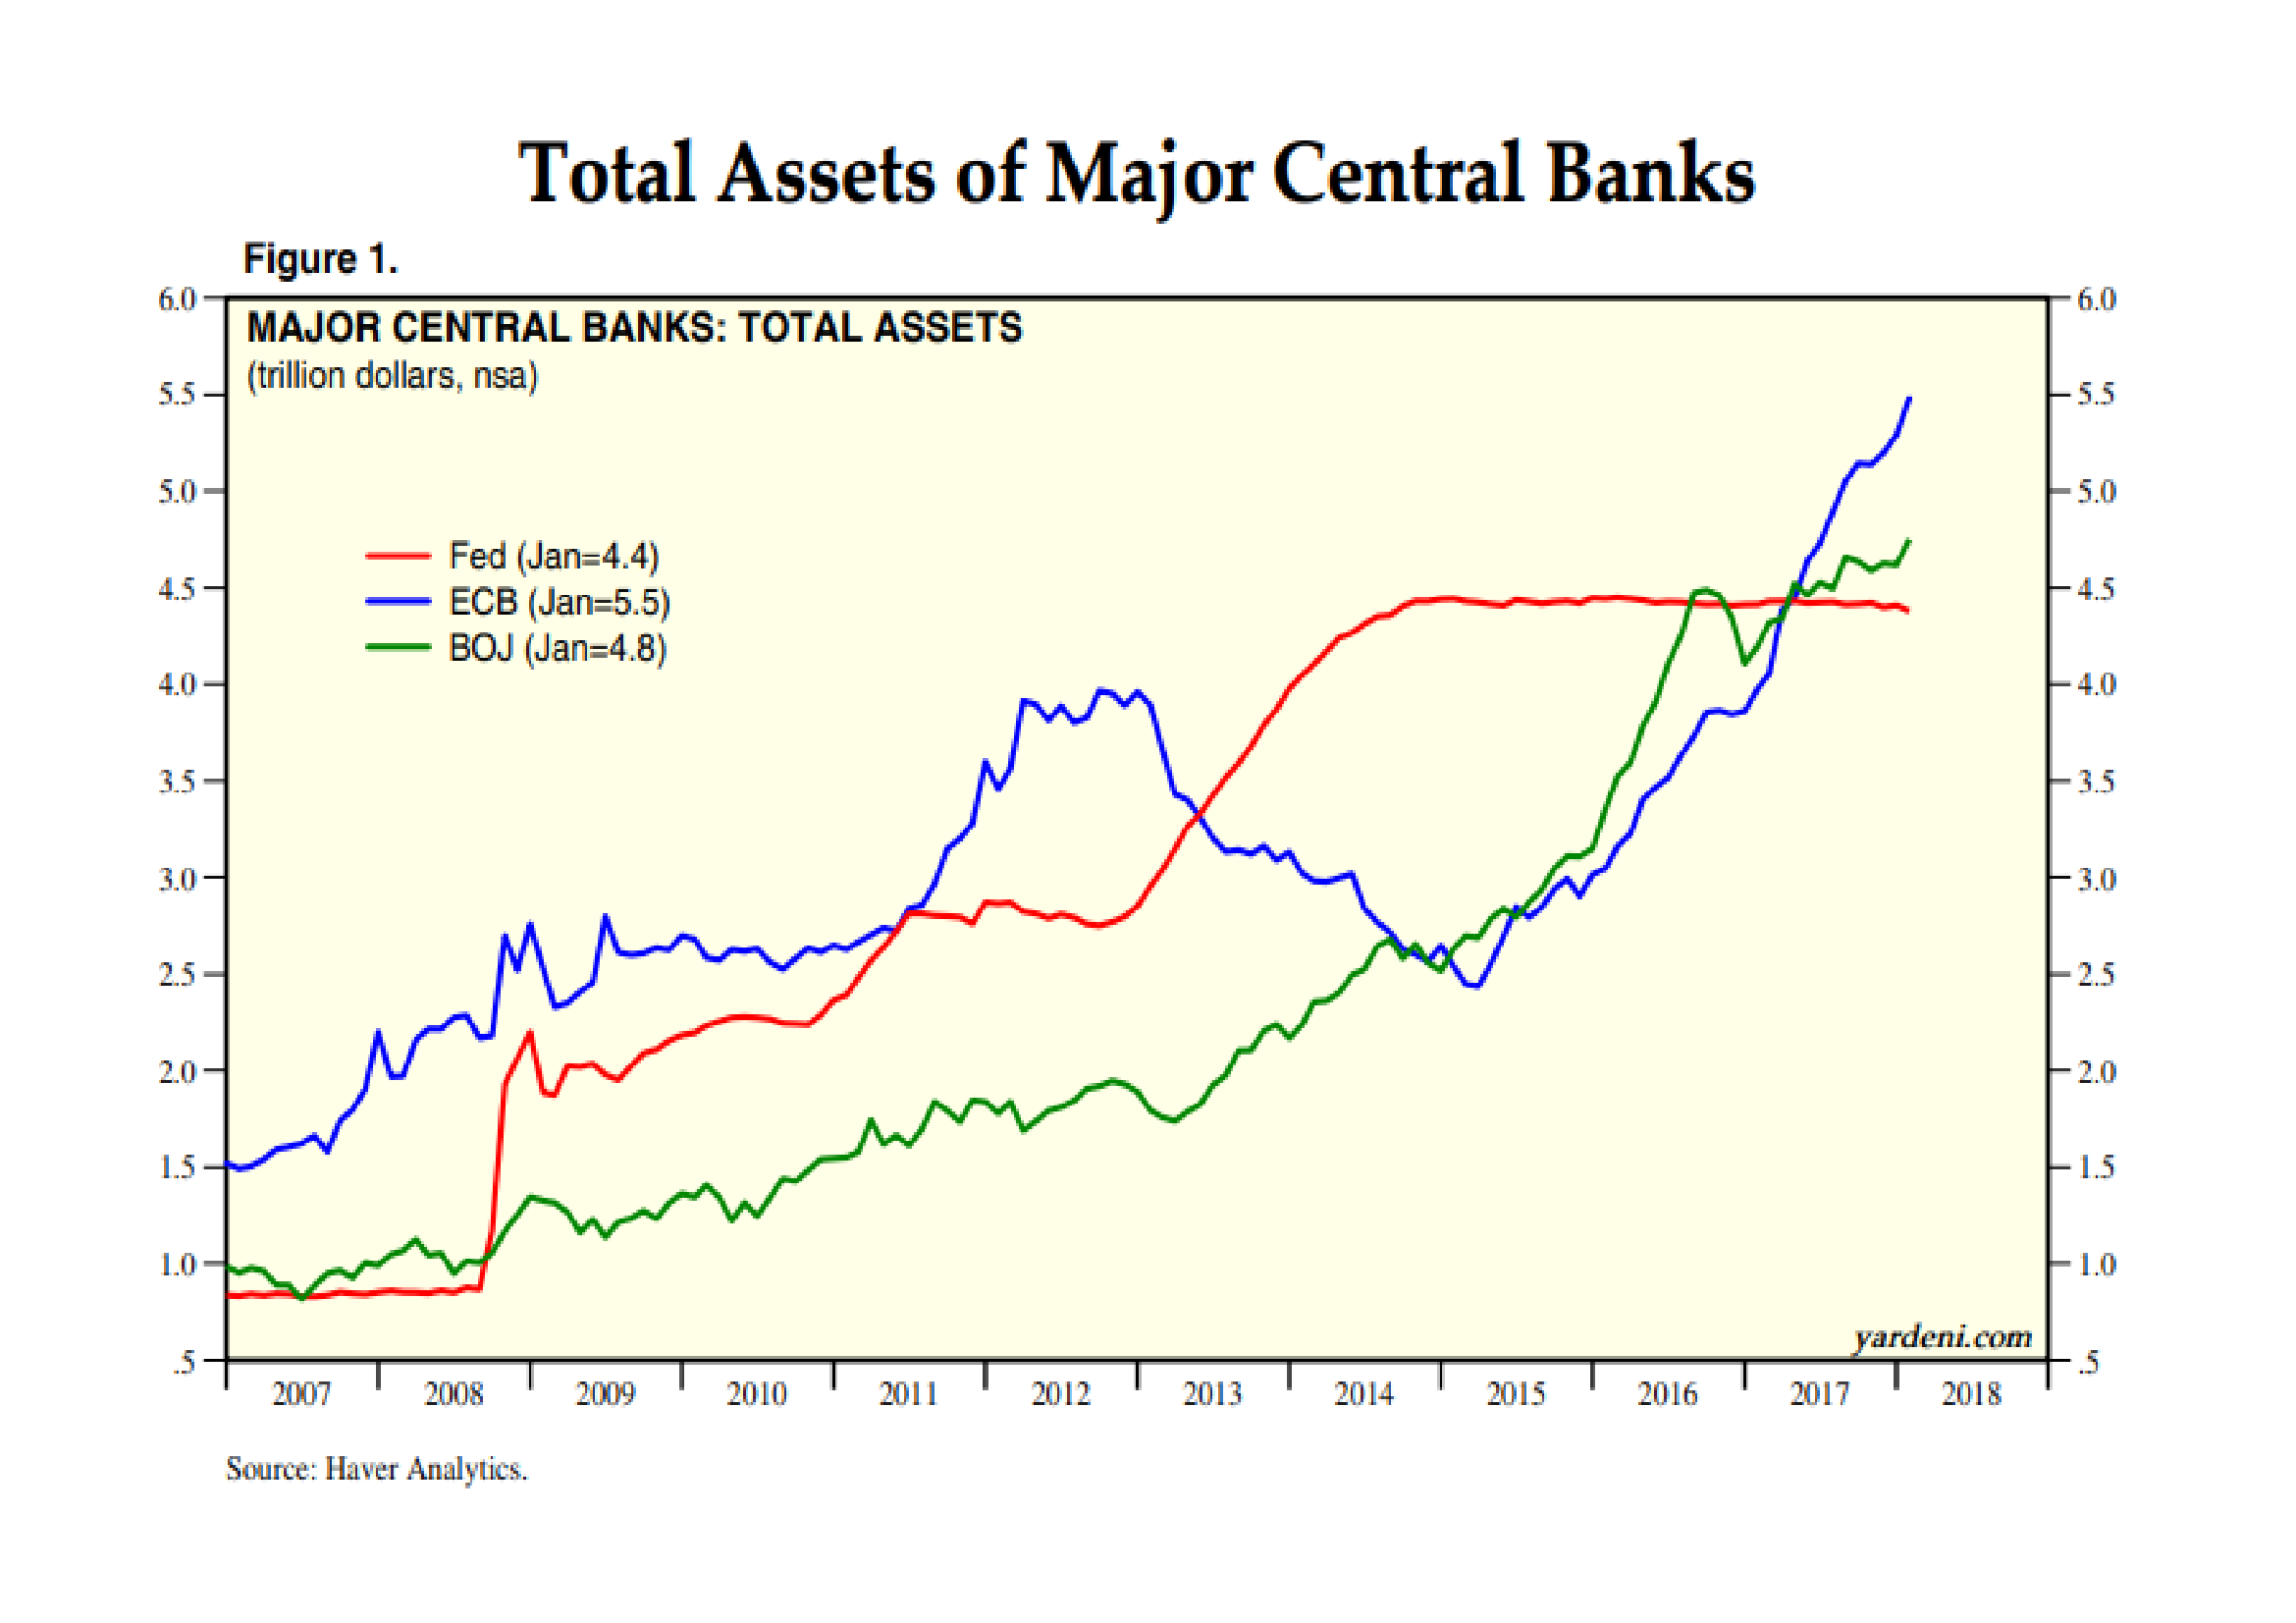
Today there are several profound differences with the 1950’s, not least, the percentage of the US bond market which is held by Central Banks. As the chart below shows, Central Banks balance sheet expansion continues, at least, at the global level: it now stands at $14.6trn:-

Source: Haver Analytics, Yardeni Research
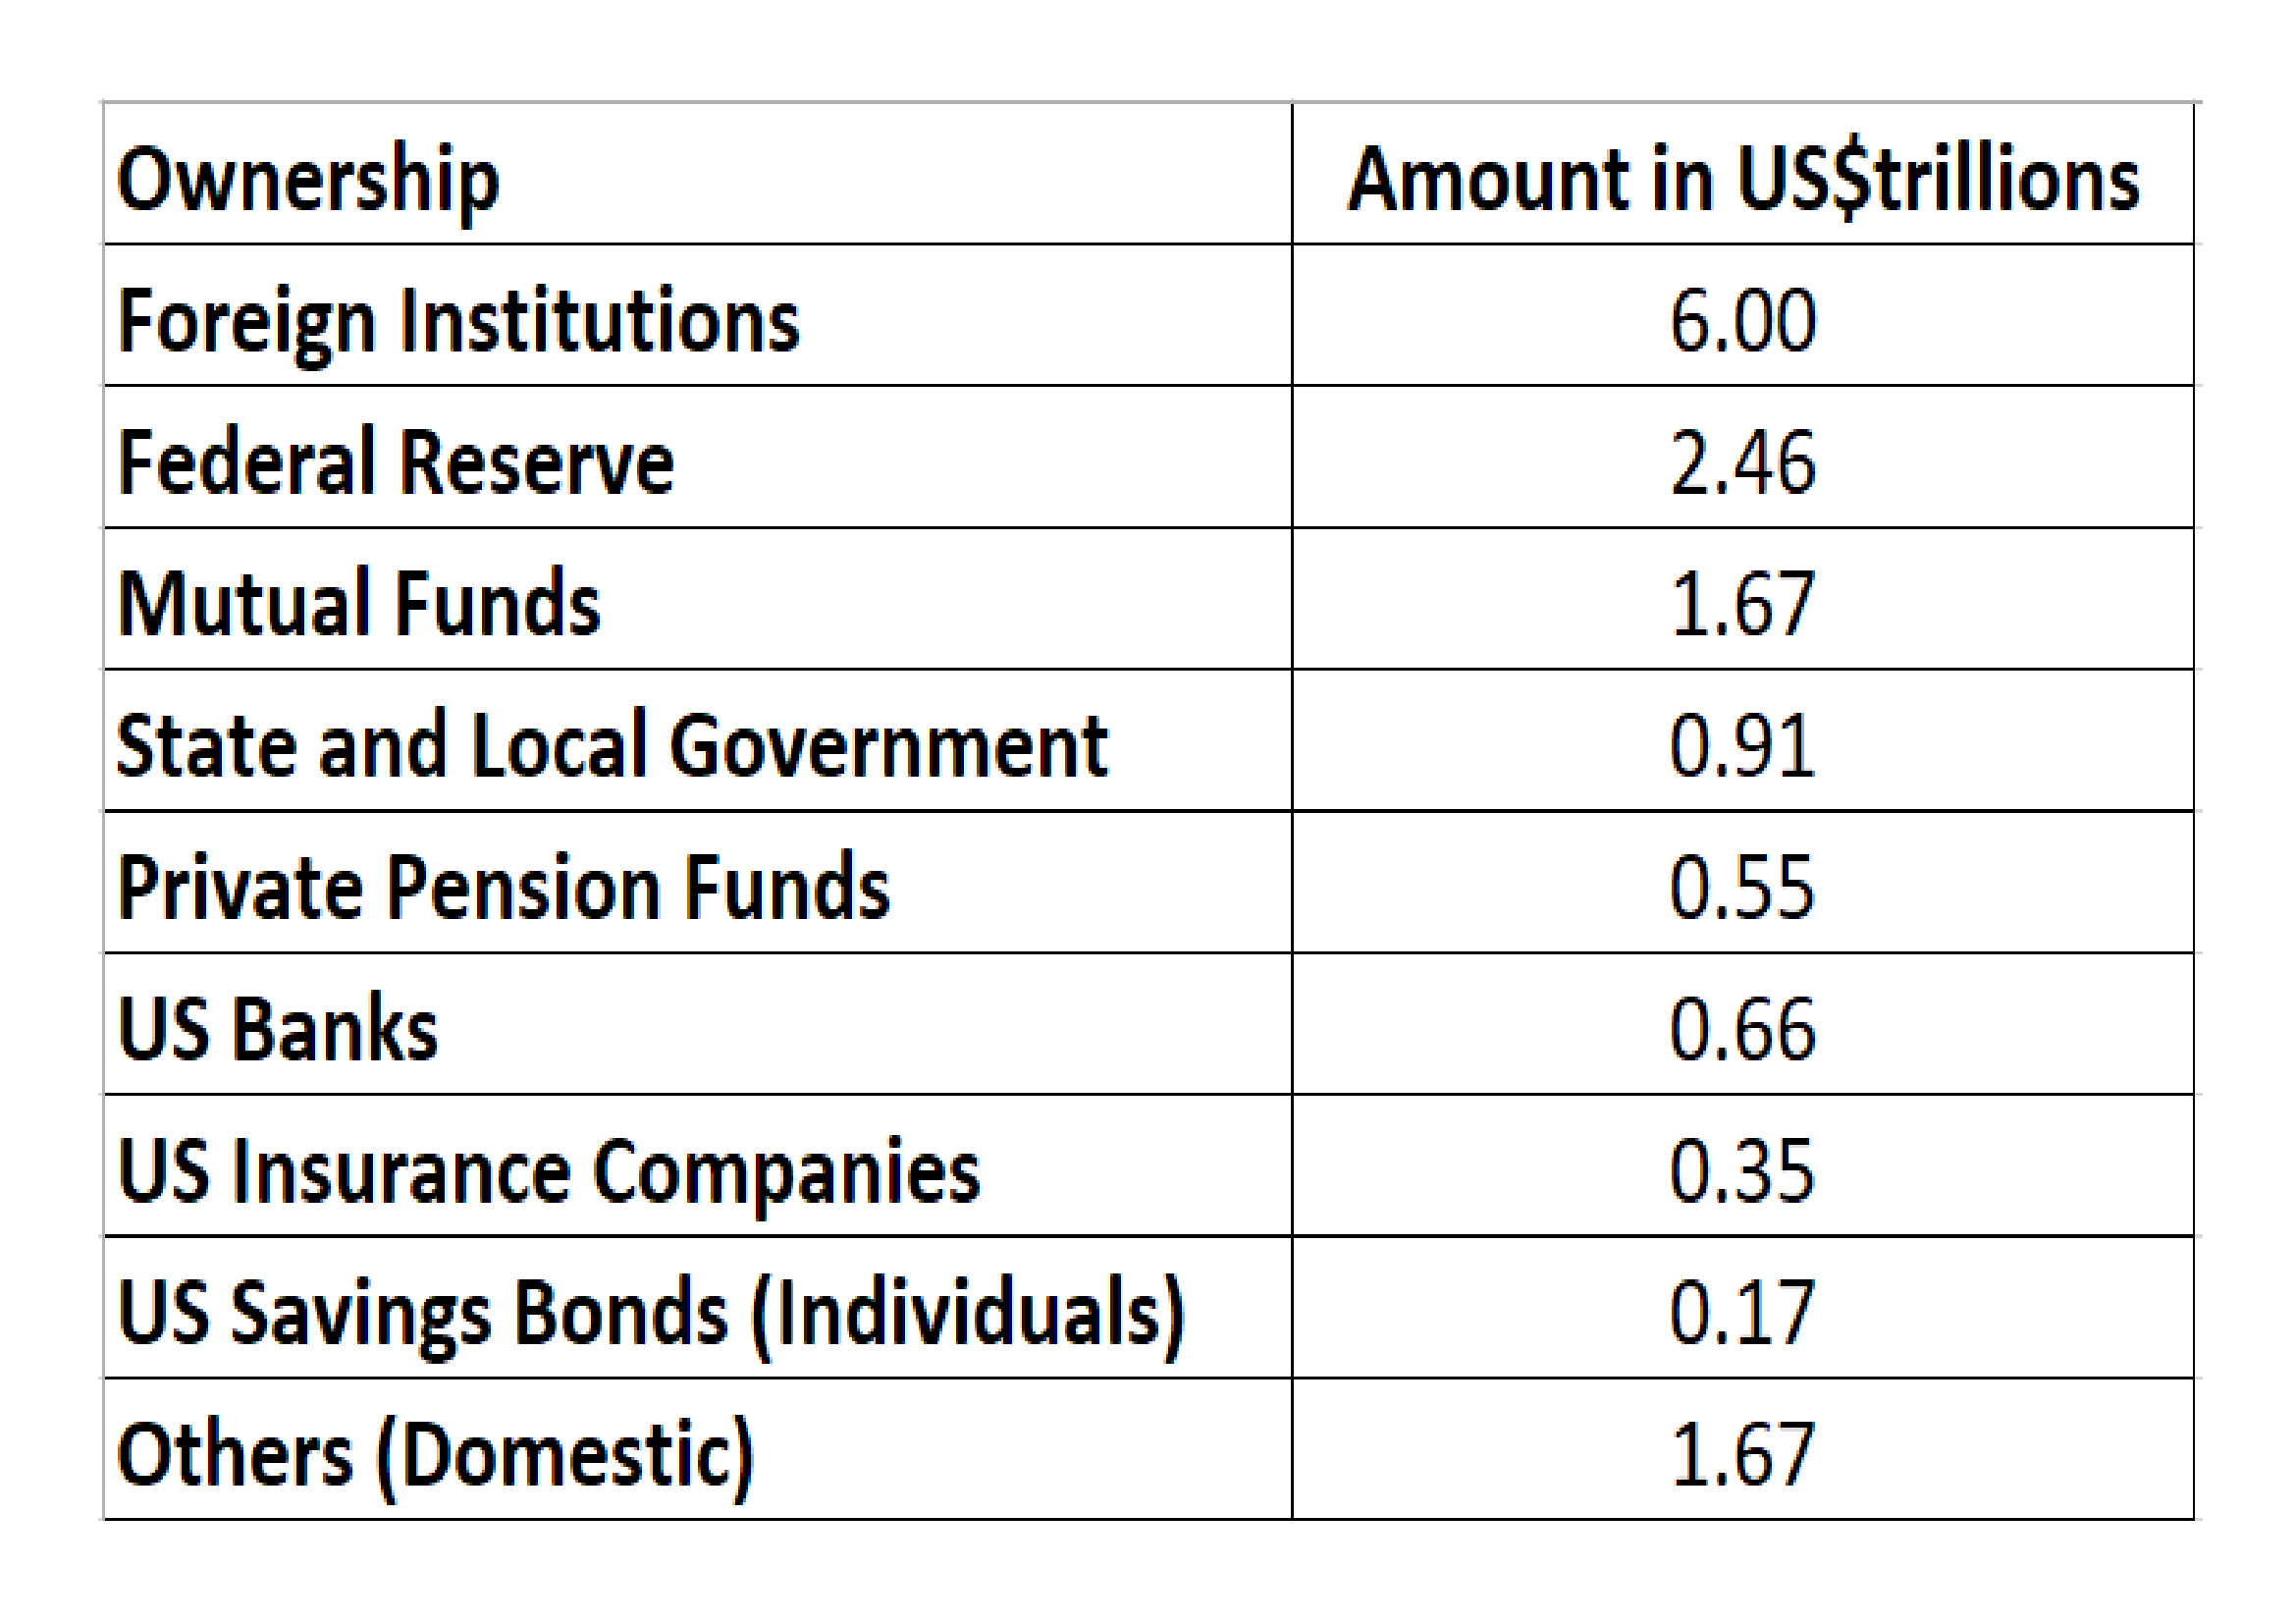
Like the Fed, the BoJ and ECB have been purchasing their own obligations, by contrast the PBoC’s modus operandi is rather different. The largest holders of US public debt (principally T-Bonds and T-Bills) are foreign institutions. Here is the breakdown as at the end of 2016:-

Source: US Treasury
As of November 2017 China has the largest holding of US debt – US$1.2trn (a combination of the PBoC and state owned enterprises), followed by Japan -US$1.1trn, made up of both private and public pension fund investments. It is not in the interests of China or Japan to allow a collapse in the US bond market, nor is it in the interests of the US government; their ability borrow at historically low yields during the last few years has not encouraged the national debt to decline, nor the budget to balance.
Bond Markets in Europe and Japan
The BoJ continues its policy of yield curve control – targeting a 10bp yield on 10yr JGBs. Its balance sheet now stands at US$4.8trn, slightly behind the ECB and PBoC which are vying for supremacy mustering US$5.5trn apiece. Thanks to the persistence of the BoJ, JGB yields have remained between zero and 10bp since November 2016. As of December 2017 the BoJ owned 46.2% of the total issuance. The ECB, by contrast, holds a mere 19.2% of Eurozone debt.
Another feature of the Eurozone bond market, during the last couple of years, has been the continued convergence in yields between the core and periphery. The chart below shows the evolution of the yield of 10yr Greek Government Bonds (LHS) and German Bunds (RHS). The spread is now at almost its lowest level ever. This may be a reflection of the improved performance of the Greek economy but it is more likely to be driven by fixed income investors continued quest for yield:-

Source: Trading Economics
By contrast with Greece (where yields have fallen) and Germany (where they are on the rise) 10yr Italian BTPs and Spanish Bonos have remained broadly unchanged, whilst French OATs have seen yields rise in sympathy with Germany. Hopes of a Eurobond backed by the EU, to replace the obligations of peripheral nation states, whilst vehemently denied in official circles, appears to remain high.
Japanese and European economic growth, which has surprised on the upside over the past year, needs to prove itself more than purely cyclical. Both regions are reliant on the relative strength of US the economic recovery, together with the continued structural expansion of China and India. The jury is out on whether either Japan or the EU can achieve economic terminal velocity without strong export markets for their goods and services.
The one country in the European area which is behaving differently is the UK; yields have risen but, it stands apart from the rest of the Eurozone; UK Gilts dance to a different tune. Uncertainty about Brexit caused Sterling to decline, especially against the Euro, import prices rose in response, pushing inflation higher. 10yr Gilt yields bottomed in August 2016 at 50bp. Since then they have risen to 1.64% – this is still some distance from the highs of January 2014 when they tested 3.09%. 2yr Gilts are different matter, with a current yield of 71bp they are 63bp from their lows but just 22bp away from the 2014 high of 93bp.
Conclusions and Investment Opportunities
From a personal investment perspective, I have been out of the bond markets since 2013. My reasoning (which proved expensive) was that the real-yields on the majority of markets was already extremely negative and the notional yields were uncomfortably close to zero. Of course these markets went much, much further than I had anticipated. Now I am tempted by the idea of reallocating, despite yields being lower than they were when I exited previously. Inflation in the US is 2.1%, in the Euro Area it is 1.3% whilst in Japan it is still just 1%.
As a defensive investment one should look for short duration bonds, but in the US this brings the investor into conflict with the hawkish policy stance of the Fed; that is, what my friend Ben Hunt of Epsilon Theory dubs, the Inflation Narrative. For a contrary view this Kansas City Fedpaper may be of interest – Has the Anchoring of Inflation Expectations Changed in the United States during the Past Decade?
In Japan yields are still too near the zero bound to be enticing. In Germany you need to need to go all the way out to 6yr maturity Bunds before you receive a positive yield. There is an alternative to consider – 2yr Gilts:-

Source: Trading Economics
UK inflation is running at 3% – that puts it well above the BoE target of 2%. Rate increases are anticipated. 2yr Gilt yields have recently followed the course steered by the US and Germany, taking out the highs last seen in December 2015, however, if (although I really mean when) a substantial stock market correction occurs, 2yr Gilt yields have the attraction of being near the top of their five year range – unlike 2yr Schatz which are nearer the bottom of theirs. 2yr Gilts will benefit from a slowdown in Europe and any uncertainty surrounding Brexit. The BoE will be caught between the need to quell inflation and the needs of the economy as a whole. 2yr Gilts also offer the best roll-down on the UK yield curve. The 1yr maturity yields 49bp, whilst the 3yr yields 83bp.
With inflation fears are on the rise, especially in the US and UK, 2yr Gilts make for an uncomfortable investment today, however, they are a serious contender as a safe place to hide, come the real stock market correction.


