- Despite US tariffs, China’s September trade balance with the US reached a record high
- A number of China’s Asian neighbours have seen a deceleration in growth
- The Shanghai Composite has fallen more than 50% since 2015, the PE ratio is 7.2
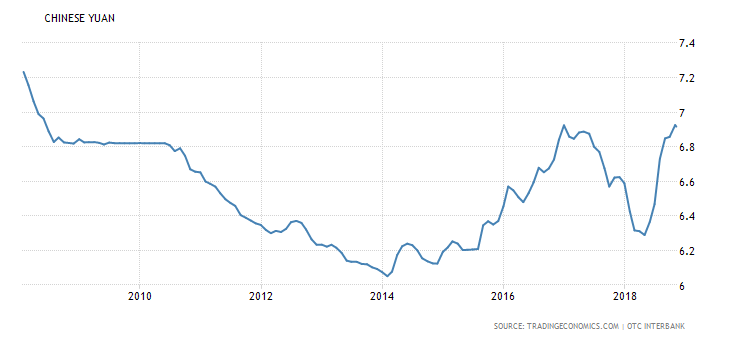
- Government bond yields have eased and the currency is lower against a rising US$
During 2018 Chinese financial markets have been on the move. 10yr bond yields rose from all-time lows throughout 2017 but have since declined: –

Source: Trading Economics, PRC Ministry of Finance
Despite this easing of monetary conditions the negative impact US tariffs, continues to weigh on the Chinese stock market: –

Source: Trading Economics, OTC, CFD
Despite being a leader in frontier technologies such as e-commerce (China has 733mln internet users compared with 391mln in India, 413mln in the EU and a mere 246mln in the US) the recent decline in tech giants Alibaba (BABA) and Tencent (TCEHY) have added to financial market woes. However, as the chart above shows, Chinese stocks have been in a bear-market since 2015. Some of its Asian neighbours have followed a similar trajectory as their economies have slowed in response to a US$ strength and US trade policy.
The notionally pegged Chinese currency has also weakened against the US$, testing it lowest levels in almost a decade: –

Source: Trading Economics
Meanwhile, President Xi has now announced plans to rebalance China’s economy towards consumption, turning it into an importing superpower. Surely something has to give.
The IMF expects Chinese GDP to grow at 6.6% in 2018. They continue to point to signs of economic progress: –
The country now accounts for one-third of global growth. Over 800 million people have been lifted out of poverty and the country has achieved upper middle-income status. China’s per capita GDP continues to converge to that of the United States, albeit at a more moderate pace in the last few years.
The authors go on to predict that the country may become the world’s largest economy by 2030. However, there are headwinds: –
Despite the sharp rebound in nominal GDP and industrial profits, total nonfinancial sector debt still rose significantly faster than nominal GDP growth in 2017. While the corporate debt to GDP ratio has stabilized, government and especially household debt is rising, driven by continued strong off-budget investment spending and a rapid increase in mortgage and consumer loans.
It is debt that concerns Carnegie Endowment’s Michael Pettis – Beijing’s Three Options: Unemployment, Debt, or Wealth Transfers – as the title suggests he envisages three paths to adjustment.
Raise investment. Beijing can engineer an increase in public-sector investment. In theory, private-sector investment can also be expanded, but in practice Chinese private-sector actors have been reluctant to increase investment, and it is hard to imagine that they would do so now in response to a forced contraction in China’s current account surplus.
Reduce savings by letting unemployment rise. Given that the contraction in China’s current account surplus is likely to be driven by a drop in exports, Beijing can allow unemployment to rise, which would automatically reduce the country’s savings rate.
Reduce savings by allowing debt to rise. Beijing can increase consumption by engineering a surge in consumer debt. A rising consumption share, of course, would mean a declining savings share.
Reduce savings by boosting Chinese household consumption. Beijing can boost the consumption share by increasing the share of GDP retained by ordinary Chinese households, those most likely to consume a large share of their increased income. Obviously, this would mean reducing the share of some low-consuming group—the rich, private businesses, state-owned enterprises (SOEs), or central or local governments.
Although fiscal stimulus appears to be rebounding it is a short-term solution. There have been many example of non-productive public investment: as a longer-term policy, this route is untenable: –
If Beijing does not rein in credit growth in time, it will be forced to do so once debt levels reach the point at which debt can no longer rise fast enough to maintain the country’s targeted economic growth rate. This adjustment can happen quickly, in the form of a debt crisis. Or (what I think is far more likely, at least for now) it can happen slowly, in the form of what is subsequently called a lost decade (or decades) of slow growth, similar to what Japan experienced after 1990.
Increased unemployment is a dangerous route to take, debt levels are already stretched, which leaves wealth transfers to the private sector.
A forced contraction in China’s current account surplus must be counteracted by either an increase in unemployment, an increase in the debt, or wealth transfers to Chines consumers (rather than savers).
Looking ahead Chinese growth is likely to slow. Here is Focus Economics – China Economic Outlook for October: –
China Economic Outlook
Available data suggests that economic growth decelerated in the third quarter, mainly due to lackluster infrastructure investment and negative spillovers from financial deleveraging. Surprisingly, export growth remained robust in Q3 despite the ongoing trade war between China and the United States. The September PMI survey, however, revealed that external demand is softening, which suggests export figures are likely to worsen in the next few months. In response, the government has reverted to old tactics, boosting lending and increasing fiscal stimulus. Although these initiatives are effective in supporting the economy in the short-term, they threaten the effort made in previous years to reshape the country’s economic model and allow the country to avoid the “middle income trap”.
China Economic Growth
Looking ahead, economic growth is expected to decelerate. This reflects China’s more mature economic cycle and the impact of previous economic reforms, as well as the tit-for-tat trade war with the United States and the cooling housing market. However, a looser fiscal stance and a more accommodative monetary policy should cushion the slowdown. FocusEconomics panelists see the economy growing 6.3% in 2019, which is unchanged from last month’s forecast. In 2020 the economy is seen expanding 6.1%.
Countering this view Peterson Economics – Who Thinks China’s Growth Is Slowing?Suggests that China may be holding up much better than imagined: –
A widespread consensus has developed around the view that China’s economic growth is slowing and that the leadership in Beijing will have no choice but to capitulate in the tariff war with President Donald Trump to avoid a further slowdown. Leading US news organizations (here and here) have sounded this theme as a kind of late summer siren song to lull people into thinking that Trump’s confrontational approach is bound to succeed at some point. The reality is that, as has been the case for the last few years, the case for China’s imminent economic difficulties is overblown.
The most widely cited piece of evidence for the new conventional wisdom, for example, is that fixed asset investment is slowing dramatically. Unfortunately, this assessment is based on a monthly data series released by China’s National Bureau of Statistics (NBS), which is currently revising the method used to calculate fixed asset investment. The method that was used so far involved considerable double counting, which the authorities are paring back. The slowing growth of this metric, thus, tells us nothing, and assessments based on existing data are no longer meaningful.
There are three sources of growth in any economy: consumption, investment, and net exports. The problem is that data on China’s fixed asset investment, which include the value of sales of land and other assets, have increasingly overstated the expansion of the economy’s productive capacity. Nonetheless, financial analysts and others have relied on this series because it is the only high-frequency data available on investment. China’s data on gross domestic capital formation, which accurately measures the expansion of productive capacity, are available only on an annual basis and with a lag of five months.
According to NBS data, fixed asset investment grew by only 5.5 percent in the first seven months of 2018, the lowest in decades. In the first half of the year (January to June), fixed asset investment grew by 6 percent. But the price index for fixed asset investment rose by 5.7 percent, implying that real investment barely grew. This, however, is inconsistent with the more reliable NBS data, which show the expansion of capital formation, properly measured, accounted for about one-third of the 6.8 percent of China’s GDP growth.
When the NBS releases final data for 2018 (probably in about nine months), we are likely to learn that the growth of capital formation, properly measured, exceeded the growth of fixed asset investment, just as it did in 2017.
The full article is in three parts – part 2 – taking a closer look at domestic consumption – is here and part 3 – charting the steady rise in imports – is here.
Conclusions and Investment Opportunities
According to analysis from Star Capital (28-9-2018) the PE ratio for Chinese Stocks was just 7.2 times – the second cheapest of the 40 stock markets they monitor – although its CAPE ratio was a more exalted 15.7. Since June 2015 the Shanghai Composite Index have fallen by 53%, peak to trough, whilst since January it has retraced 32% to its low last month. The downtrend has yet to reverse, but, as the second chart above shows, we are testing a support line taken from the lows of 2005 and 2014.
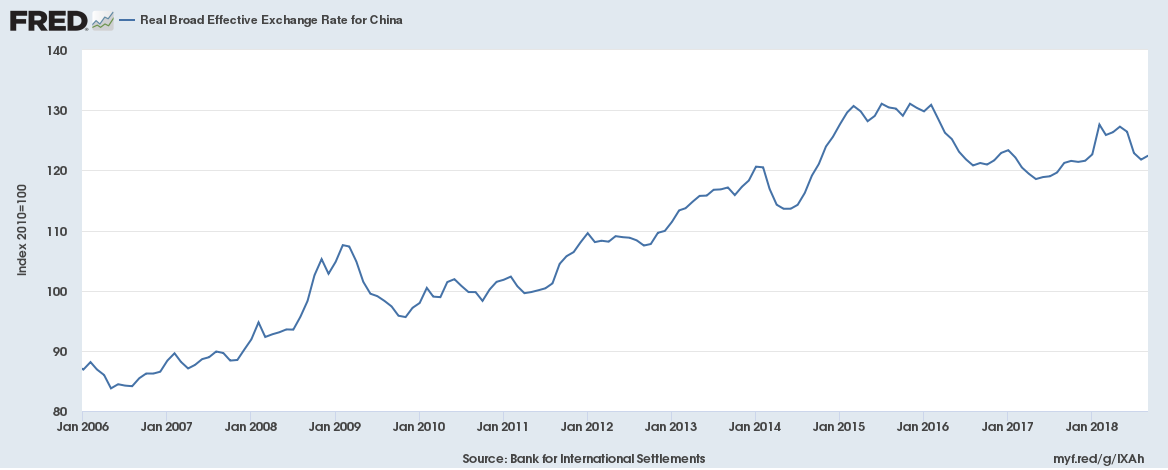
The Q2 2018 Monetary Policy Report the PBoC revealed a moderation in the rate of growth of loans to households to 18.8%, other areas of lending continue to expand rapidly. M2 growth has been steady at around 8%. I believe they will allow interest rates to remain unchanged at 4.35%, or reduce them should the need arise. Last month PBoC foreign exchange reserves fell slightly (-$34bln) but they remain above $3trln: enough to moderate the RMBs decline. China’s real broad effective exchange rate (trade-weighted) is still in a broad, multi-year uptrend due to its soft peg to the US$. Here is the chart since 2006: –

Source: Federal Reserve Bank of St Louis
I expect China to reach a trade deal with the US within the next year. The recent slowdown in growth rate of debt formation by households will reverse: and the Shanghai Composite Index will form a base. The RMB may weaken further as the US continues to raise interest rates. Provided the US stock market maintains its nerve, an opportunity to buy Chinese stocks may emerge in the next few months. It may not yet be time to buy but there is little benefit in remaining short.


