- Despite the fourth quarter shakeout in stocks, real estate values keep rising
- Financial conditions remain key, especially in a low rate environment
- Isolated instances of weakness have yet to breed contagion
- The reversal of central bank tightening has averted a more widespread correction
I last wrote about the prospects for global real estate back in February 2018 in Macro Letter – No 90 – A warning knell from the housing market – inciting a riot? I concluded: –
The residential real estate market often reacts to a fall in the stock market with a lag. As commentators put it, ‘Main Street plays catch up with Wall Street.’ The Central Bank experiment with QE, however, makes housing more susceptible to, even, a small rise in interest rates. The price of Australian residential real estate is weakening but its commodity rich cousin, Canada, saw major cities price increases of 9.69% y/y in Q3 2017. The US market also remains buoyant, the S&P/Case-Shiller seasonally-adjusted national home price index rose by 3.83% over the same period: no sign of a Federal Reserve policy mistake so far.
As I said at the beginning of this article, all property investment is ‘local’, nonetheless, Australia, which has not suffered a recession for 26 years, might be a leading indicator. Contagion might seem unlikely, but it could incite a riot of risk-off sentiment to ripple around the globe.
More than a year later, central bank interest rates seem to have peaked (if indeed they increased at all) bond yields in most developed countries are falling again and, another round of QE is hotly anticipated, at the first hint of a global, or even regional, slowdown in growth.
In the midst of this sea-change from tightening to easing, an article from the IMF – Assessing the Risk of the Next Housing Bust – appeared earlier this month, in which the authors remind us that housing construction and related spending account for one sixth of US and European GDP. A boom and subsequent bust in house prices has been responsible for two thirds of recessions during the past few decades, nonetheless, they find that: –
…in most advanced economies in our sample, weighted by GDP, the odds of a big drop in inflation-adjusted house prices were lower at the end of 2017 than 10 years earlier but remained above the historical average. In emerging markets, by contrast, riskiness was higher in 2017 than on the eve of the global financial crisis. Nonetheless, downside risks to house prices remain elevated in more than 25 percent of these advanced economies and reached nearly 40 percent in emerging markets in our study.
The authors see a particular risk emanating from China’s Eastern provinces but overall they expect conditions to remain reasonably benign in the short-term. The January 2019 IMF – Global Housing Watch – presents the situation as at Q2 and Q3 2018: –

Source: IMF, BIS, Federal Reserve, ECB, Savills, Sinyl, National Data
Hong Kong continues to boom and Ireland to rebound.
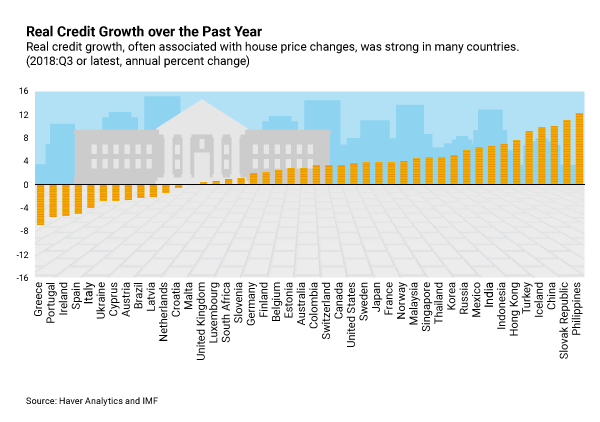
They go on to analyse real credit growth: –
Source: IMF, Haver Analytics
Interestingly, for several European countries (including Ireland) credit conditions have been tightening, whilst Hong Kong’s price rises seem to be underpinned by credit growth.
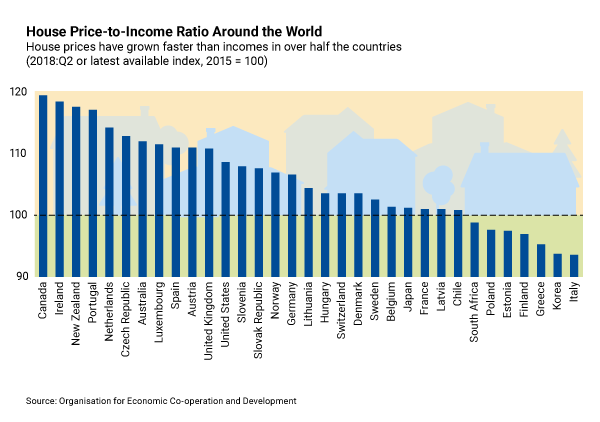
Then the IMF compare house prices to average income: –
Source: IMF, OECD
Canada comes to the fore-front but Ireland is close second with New Zealand and Portugal not far behind.
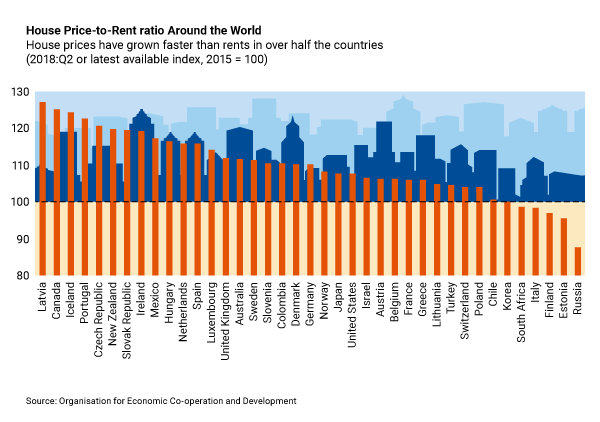
Finally the authors assess House price/Rent ratios: –
Source: IMF, OECD
Both Canada, Portugal and New Zealand are prominent as is Ireland.
This one year snap-shot disguises some lower term trends. The following chart from the September 2018 – UBS Global Real Estate Bubble Index puts the housing market into long-run perspective.
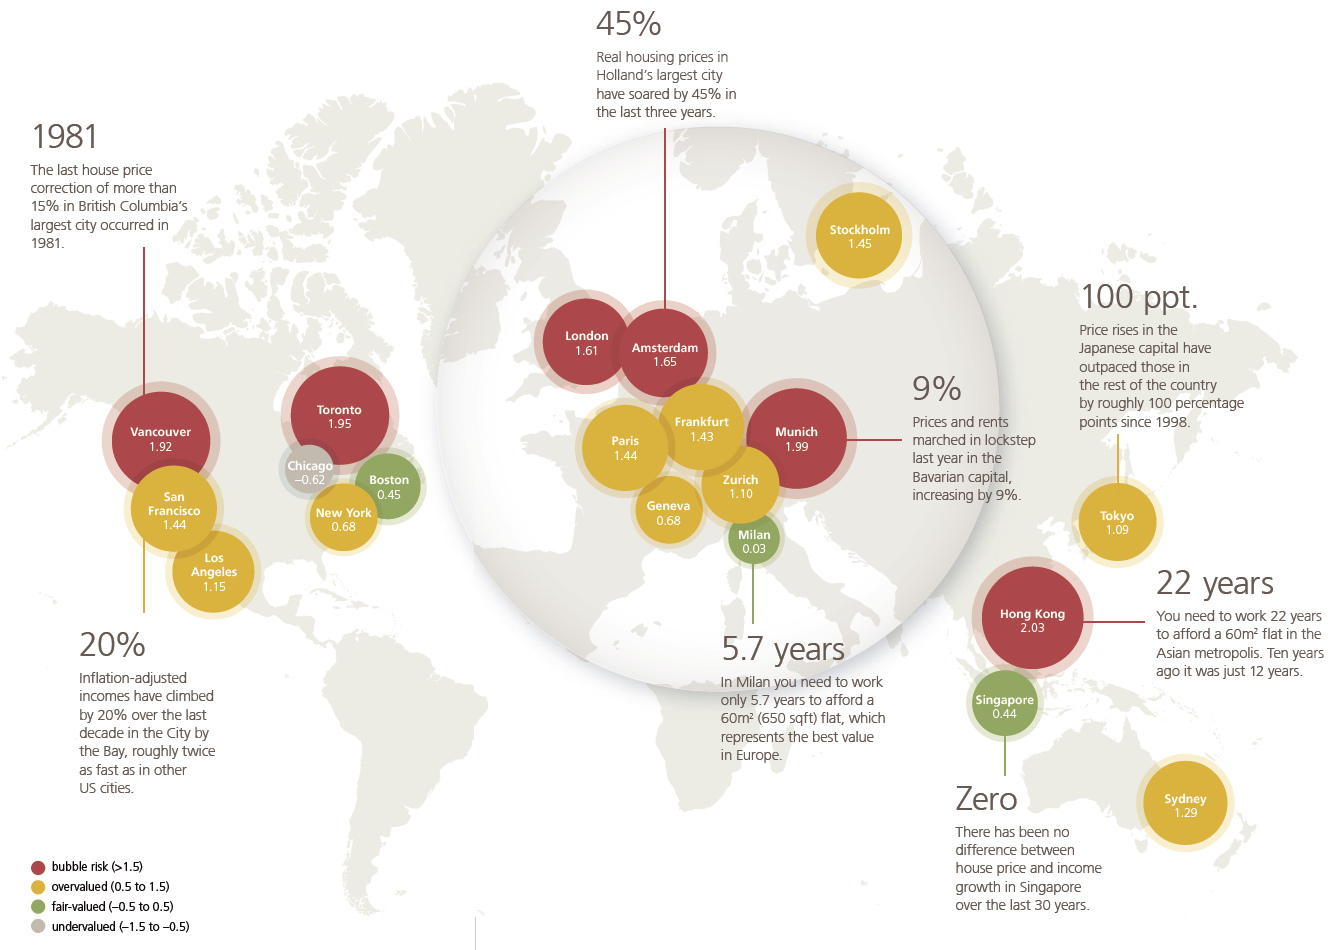
Source: UBS
UBS go on to rank most expensive cities for residential real estate, pointing out that top end housing prices declined in half of the list:-

Source: UBS
Over the 12 months to September 2018 UBS note that house prices declined in Milan, Toronto, Zurich, New York, Geneva, London, Sydney and Stockholm. The chart below shows the one year change (light grey bar) and the five year change (dark grey line): –

Source: UBS
Is a global correction coming or is property, as always, local? The answer? Local, but with several local markets still at risk.
The US market is generally robust. According to Peter Coy of Bloomberg – America Isn’t Building Enough New Housing – the effect of the housing collapse during the financial crisis still lingers, added to which zoning rules are exacerbating an already small pool of construction-ready lots. Non-credit factors are also corroborated by a recent Fannie Mae survey of housing lenders which found only 1% blaming tight credit, whilst 48% pointed to lack of supply.
North of the border, in Canada, the outlook has become less favourable, partly due to official intervention which began in 2017. Since 2012, house price increases in Toronto accelerated away from other cities, Vancouver followed with a late rush after 2015 and price increases only stalled in the last year.
In their February 2019 report Moody Analytics – 2019 Canada Housing Market Outlook: Slower, Steadier – identify the risks as follows: –
Interventions by the BoC, OSFI, and the British Columbia and Ontario governments were by no means a capricious attempt to deflate a house price bubble for the mere sake of deflation. Financial and macroeconomic aggregates point to the possibility that the mortgage credit needed to sustain house price appreciation may be unsustainable. Since 2002, the ratio of mortgage debt service payments to disposable income has gone from a historical low point of little more than 5% in 2003 to almost 6.6% by the end of last year…
The authors go on to highlight the danger of the overall debt burden, should interest rates rise, or should the Canadian economy slow, as it is expected to do next year. They expect the ratio of household interest payments to disposable income to rise and the percentage of mortgage arrears to follow a similar trajectory. In reality the rate of arrears is still forecast to reach only 0.3%, significantly below its historical average.
External factors could create the conditions for a protracted slump in Canadian real estate. Moody’s point to a Chinese real estate crash, a no-deal Brexit, renewed austerity in Europe and a continuation of the US/China trade dispute as potential catalysts. In this scenario 4% of mortgages would be in arrears. For the present, however, Canadian housing prices remain robust.
Switching to China, the CBRE – Greater China Real Estate Market Outlook 2019 – paints a mixed picture of commercial real estate in the year ahead: –
Office: U.S.–China trade conflict and the ensuing economic uncertainty are set to dent office demand in mainland China and Hong Kong. Leasing momentum in Taiwan will be less affected. Office rents will likely soften in oversupplied and trade and manufacturing-driven cities in 2019.
Retail: The amalgamation of online and offline will continue to drive the evolution of retail demand on the mainland. Retailers in Hong Kong and Taiwan will adopt a conservative approach towards expansion due to the diminishing wealth effect. Retail rents are projected to stay flat or grow slightly in most markets across Greater China.
Logistics: Tight land and warehouse supply will translate into steady logistics rental growth in the Greater Bay Area, Yangtze River Delta and Pan-Beijing area. Risks include potential weaker leasing demand stemming from the U.S.-China trade conflict and the gradual migration to self-built warehouses by major e-commerce companies.
The Chinese housing market, by contrast, has suffered from speculative over-supply. Estimates last year suggested that 22% of homes, amounting to around 50 million dwellings, are unoccupied. Government intervention has been evident for several years in an attempt to moderate price fluctuations. Earlier this month the National Development and Reform Commission (NDRC) said it aims to increase China’s urbanization rate by at least 1% with the aim of tackling the surfeit of supply. This is part of a longer-term goal to bring 100 million people into the cities over the five years to 2020. As of last year, 59.6% of China’s population lived in urban areas. According to World Bank data high middle income countries average 65% rising to 82% for high income countries. For China to reach the average high middle income average, another 70mln people need to move from rural to urban regions.
The new NDRC strategy will include the scrapping of restrictions on household registration permits for non-residents in cities of one to three million. For cities of three to five million, restrictions will be “comprehensively relaxed,” although the NDRC did not specify the particulars. Banks will be incentivised to provide credit and the agency also stated that it will support the establishing of real estate investment trusts (REITs) in order to promote a deepening of the residential rental market.
The NDRC action might seem unnecessary, average prices of new homes in the 70 largest Chinese cities rose 10.4% in February, up from 10.0% the previous month. This is the 46th straight monthly price increase and the strongest annual gain since May 2017. Critics point to cheap credit as the principal driver of this trend, they highlight the danger to domestic prices should the government decide to constrain credit growth. The key to maintaining prices is to open the market to foreign capital, this month’s NDRC policy announcement is a gradual step in that direction. It is estimated that at least $50bln of foreign capital will flow China over the next five years.
Despite the booming residential property market, the Chinese government has been tightening credit conditions and cracking down on illegal financial outflows. This has had impacted Australia in particular, investment fell more than 36% to $.8.2bln last year, down from $13bln in 2017. Mining investment fell 90%, while commercial real estate investment declined by 32%, to $3bln from $4.4bln the previous year. Investment in the US and Canada fell even more, declining by 83% and 47% respectively. Globally, however, Chinese investment has continued to grow, rising 4.2%.
Australian residential housing prices, especially in the major cities, have suffered from this downdraft. According to a report, released earlier this month by Core Logic – Falling Property Values Drags Household Wealth Lower – the decline in prices, the worst in more than two decades, is beginning to bite: –
According to the ABS (Australian Bureau of Statistics), total household assets were recorded at a value of $12.6 trillion at the end of 2018. Total household assets have fallen in value over both the September and December 2018 quarters taking household wealth -1.6% lower relative to June 2018. While the value of household assets have fallen by -1.6% over the past two quarters, liabilities have increased by 1.5% over the same period to reach $2.4 trillion. As a result of falling assets and rising liabilities, household net worth was recorded at $10.2 trillion, the lowest it has been since September 2017…
As at December 2018, household debt was 189.6% of disposable income, a record high and up from 188.7% the previous quarter. Housing debt was also a record high 140.2% of disposable income and had risen from 139.5% the previous quarter.
In 2018 the Australian Residential Property Price Index fell 5.1%, worst hit was Sydney, down 7.8% followed by Melbourne, off 6.4%, Darwin, down 3.5% and Perth, which has been in decline since 2015, which shed a further 2.5%. The ABS cited tightening credit conditions and reduced demand from investors and owner occupiers.
According to many commentators, Australian property has been ready to crash since the bursting of the tech bubble but, as this chart shows, prices are rich but not excessive: –

Source: AMP Capital
Conclusions and Investment Opportunities
The entire second chapter of the IMF – Global Financial Stability Report – published on 10thApril, focusses on housing: –
Large house price declines can adversely affect macroeconomic performance and financial stability, as seen during the global financial crisis of 2008 and other historical episodes. These macro-financial links arise from the many roles housing plays for households, small firms, and financial intermediaries, as a consumption good, long-term investment, store of wealth, and collateral for lending, among others. In this context, the rapid increase in house prices in many countries in recent years has raised some concerns about the possibility of a decline and its potential consequences…
Capital inflows seem to be associated with higher house prices in the short term and more downside risks to house prices in the medium term in advanced economies, which might justify capital flow management measures under some conditions. The aggregate analysis finds that a surge in capital inflows tends to increase downside risks to house prices in advanced economies, but the effects depend on the types of flows and may also be region- or city-specific. At the city level, case studies for Canada, China, and the United States find that flows of foreign direct investment are generally associated with lower future risks, whereas other capital inflows (largely corresponding to banking flows) or portfolio flows amplify downside risks to house prices in several cities or regions. Altogether, when nonresident buyers are a key risk for house prices, contributing to a systemic overvaluation that may subsequently result in higher downside risk, capital flow measures might help when other policy options are limited or timing is crucial. As in the case of macroprudential policies, these measures would not amount to targeting house prices but, instead, would be consistent with a risk management approach to policy. In any case, these conditions need to be assessed on a case-by-case basis, and any reduction in downside risks must be weighed against the direct and indirect benefits of free and unrestricted capital flows, including better smoothing of consumption, diversification of financial risks, and the development of the financial sector.
Aside from some corrections in certain cities (notably Vancouver, Toronto, Sydney and Melboune) prices continue to rise in most regions of the world, spurred on by historically low interest rates and generally benign credit conditions. As I said in last month’s Macro Letter – China in transition – From manufacturer to consumer – China will need to open its borders to foreign investment as its current account switches from surplus to deficit. Foreign capital will flow into Chinese property and, when domestic savings are permitted to exit the country, Chinese capital will support real estate elsewhere. The greatest macroeconomic risk to global housing markets stems from a tightening of financial conditions. Central banks appear determined to lean against the headwinds of a recession. In the long run they may fail but in the near-term the global housing market still looks unlikely to implode.

