Recent dollar strength has been a surprise to many but a strong dollar was also a key component of the Asian currency crises of 1997-98. These contributed to sharply lower oil prices, which in turn helped to trigger the 1998 Russian debt default, European bond spread de-convergence and spectacular blowup of hedge-fund Long Term Capital Management (LTCM). It is worth recalling that, when LTCM failed, the dollar abruptly gave up a full year of gains. While history rhymes rather than repeats, I suspect something comparable is likely in 2015, although with US total economy debt much higher, the potential for a sharp decline in the dollar is that much greater.
Back when I managed macro strategy teams at investment banks, I had a simple set of guidelines that I required junior strategists to follow when making investment recommendations, that is, in addition to those required by the firm or the regulators. These included:
- Recommendations must be supported by a broad range of fact-checked evidence, rather than one or two ‘cherry-picked’ pieces;
- Recommendations must be ‘actionable’ in a practical way by the target clients and one or more of these must be specified;
- Recommendations must not only provide a specific price (or return) target, but also an estimate of risk (or volatility) and reference to a specific time horizon;
- Recommendations must include one or more conditions under which the particular investment would no longer be as attractive, if at all.
In practice, most analysts managed in their initial draft recommendations to follow the first two but struggled when it came to the third and fourth. The reason for this is most probably the inclination that many if not all quantitative-analytical types have for expecting that financial assets be priced ‘correctly’, according to whatever analytical framework is applied. If something is out of line, so the thinking goes, it should start correcting as soon as the analysis in question is complete and should completely correct over the short-to-medium term time horizon of primary importance to the bulk of those active in the investment management industry.
While that might seem reasonable, the problem is that, notwithstanding claims to the contrary, investors are not rational. Indeed, I would hold that no economic actors are rational in any meaningful, measurable way. This is due in part to my view of human nature and modern psychology seems to uncover new ways in which our minds are biased and irrational with each passing day. But if all investment opinions are biased and irrational to some degree, the sum of all such opinions—the financial markets—is most probably also biased and irrational.
So-called ‘behavioural investing’ tries to address these biases in a systematic way in order generate excess investment returns over time with acceptably low risk. However, the problem with any such ‘fight the irrational herd’ approach is, to paraphrase Keynes, “The herd can remain irrational longer than the rational investor can remain solvent.” On top of this there is the added complexity of the so-called ‘beauty contest’, also mentioned by Keynes, in which investors constantly try to out-guess each others’ intentions, irrational, behavioural or otherwise, so what in fact is ultimately decisive in price determination at any point in time arguably has little if anything to do with any underlying, fundamental, rational investment process.
Having been an active investor for many years, I have experienced a number of profit and loss events across a broad range of assets and strategies. In the end, while idea generation, however rudimentary, is necessary to active trading or investing, it is ultimately some aspect of risk management, of knowing when NOT to trade or invest, that often tips the balance between success and failure. Sure, anyone can be ‘smart’ or ‘lucky’ for a time but the irrational herd is far more dangerous to the unusually smart than to the lucky, even though many in the latter category no doubt consider themselves also (or perhaps exclusively) in the former camp.
The fight against irrationality, if one wishes to call it that, is thus one that is overwhelming more likely to be won in the longer-term, over which most investors have only little or no interest. In the economic jargon, investors have high ‘time preference’ to front-load investment returns, by implication taking irrationally large longer-term risks. For institutional investors managing other peoples’ money, it is often a losing business proposition to fight the herd so aggressively as to risk losing clients, even if the investment views implemented ultimately work out longer-term. Holding on to client money month after month, quarter after quarter, year after year, when an apparently irrational market chooses to become ever more irrational is a potentially career-limiting move in the extreme. Thus herd-following, rather than fighting, becomes the industry norm, and those who rise to the top of large asset management organisations do so not because they are great investors but because they are skilled at retaining client assets regardless of the direction in which the irrational herd is travelling.
This natural (if irrational) herding tendency is further exaggerated when economic or monetary officials intervene in order to ‘stabilise’ asset markets, which at least since 1987 has meant to prevent them from correcting violently to the downside. 1. When the herd believes that officials have their backs, they tend to ignore the risks closing in on their backsides for far longer than they ought to. And so the inevitable bubbles that form can continue to grow and grow, yet concern about them fades and fades, as normalcy bias and policy goals converge in a world of ever-rising or at least not falling asset prices.
In this world, biased by policy towards steadily rising asset prices, returns beget leverage, and leveraged returns beget greater leverage. Regulators pretend as if they can manage this and its probable future effects on the financial system and economy, but 2008 and many other manias, panics and crashes that have come and gone before inform us otherwise. Sure, a new regulatory effort is rolled out now and again, to much fanfare: Note the central bankers’ ‘macroprudential’ PR campaign over the past two years. The ivory-tower academic folk who originally propose such measures—or so they claim—applaud on the sidelines while taking implied, self-serving credit. (These academics are equally quick to blame the ‘private sector’ whenever anything goes wrong, as their ideas can’t possibly be at fault.)
I’ve been around long enough to see this dynamic play out on multiple occasions. I also witnessed first-hand the spectacular events of 1997-98, a period with strong parallels to today. Back then, the dollar rose on the false view that the US could decouple from crises abroad. When events abruptly proved otherwise, the dollar gave up a full year’s gains in just two weeks. The same could happen in 2015.
POOR-QUALITY GROWTH, RISING IMBALANCES
Following six years of zero interest rates and QE, the US economy has still failed to resume healthy, sustainable growth. Yes, the economy is growing at present and there have been some pockets of deleveraging. But this amounts to ‘cherry picking’ the range of available evidence and thus fails to adhere to even the first of my guidelines for investment recommendations. Looking behind the numbers in more detail, as I prefer to do, one sees an unbalanced economy that is re-leveraging amid the growth of yet another asset bubble.
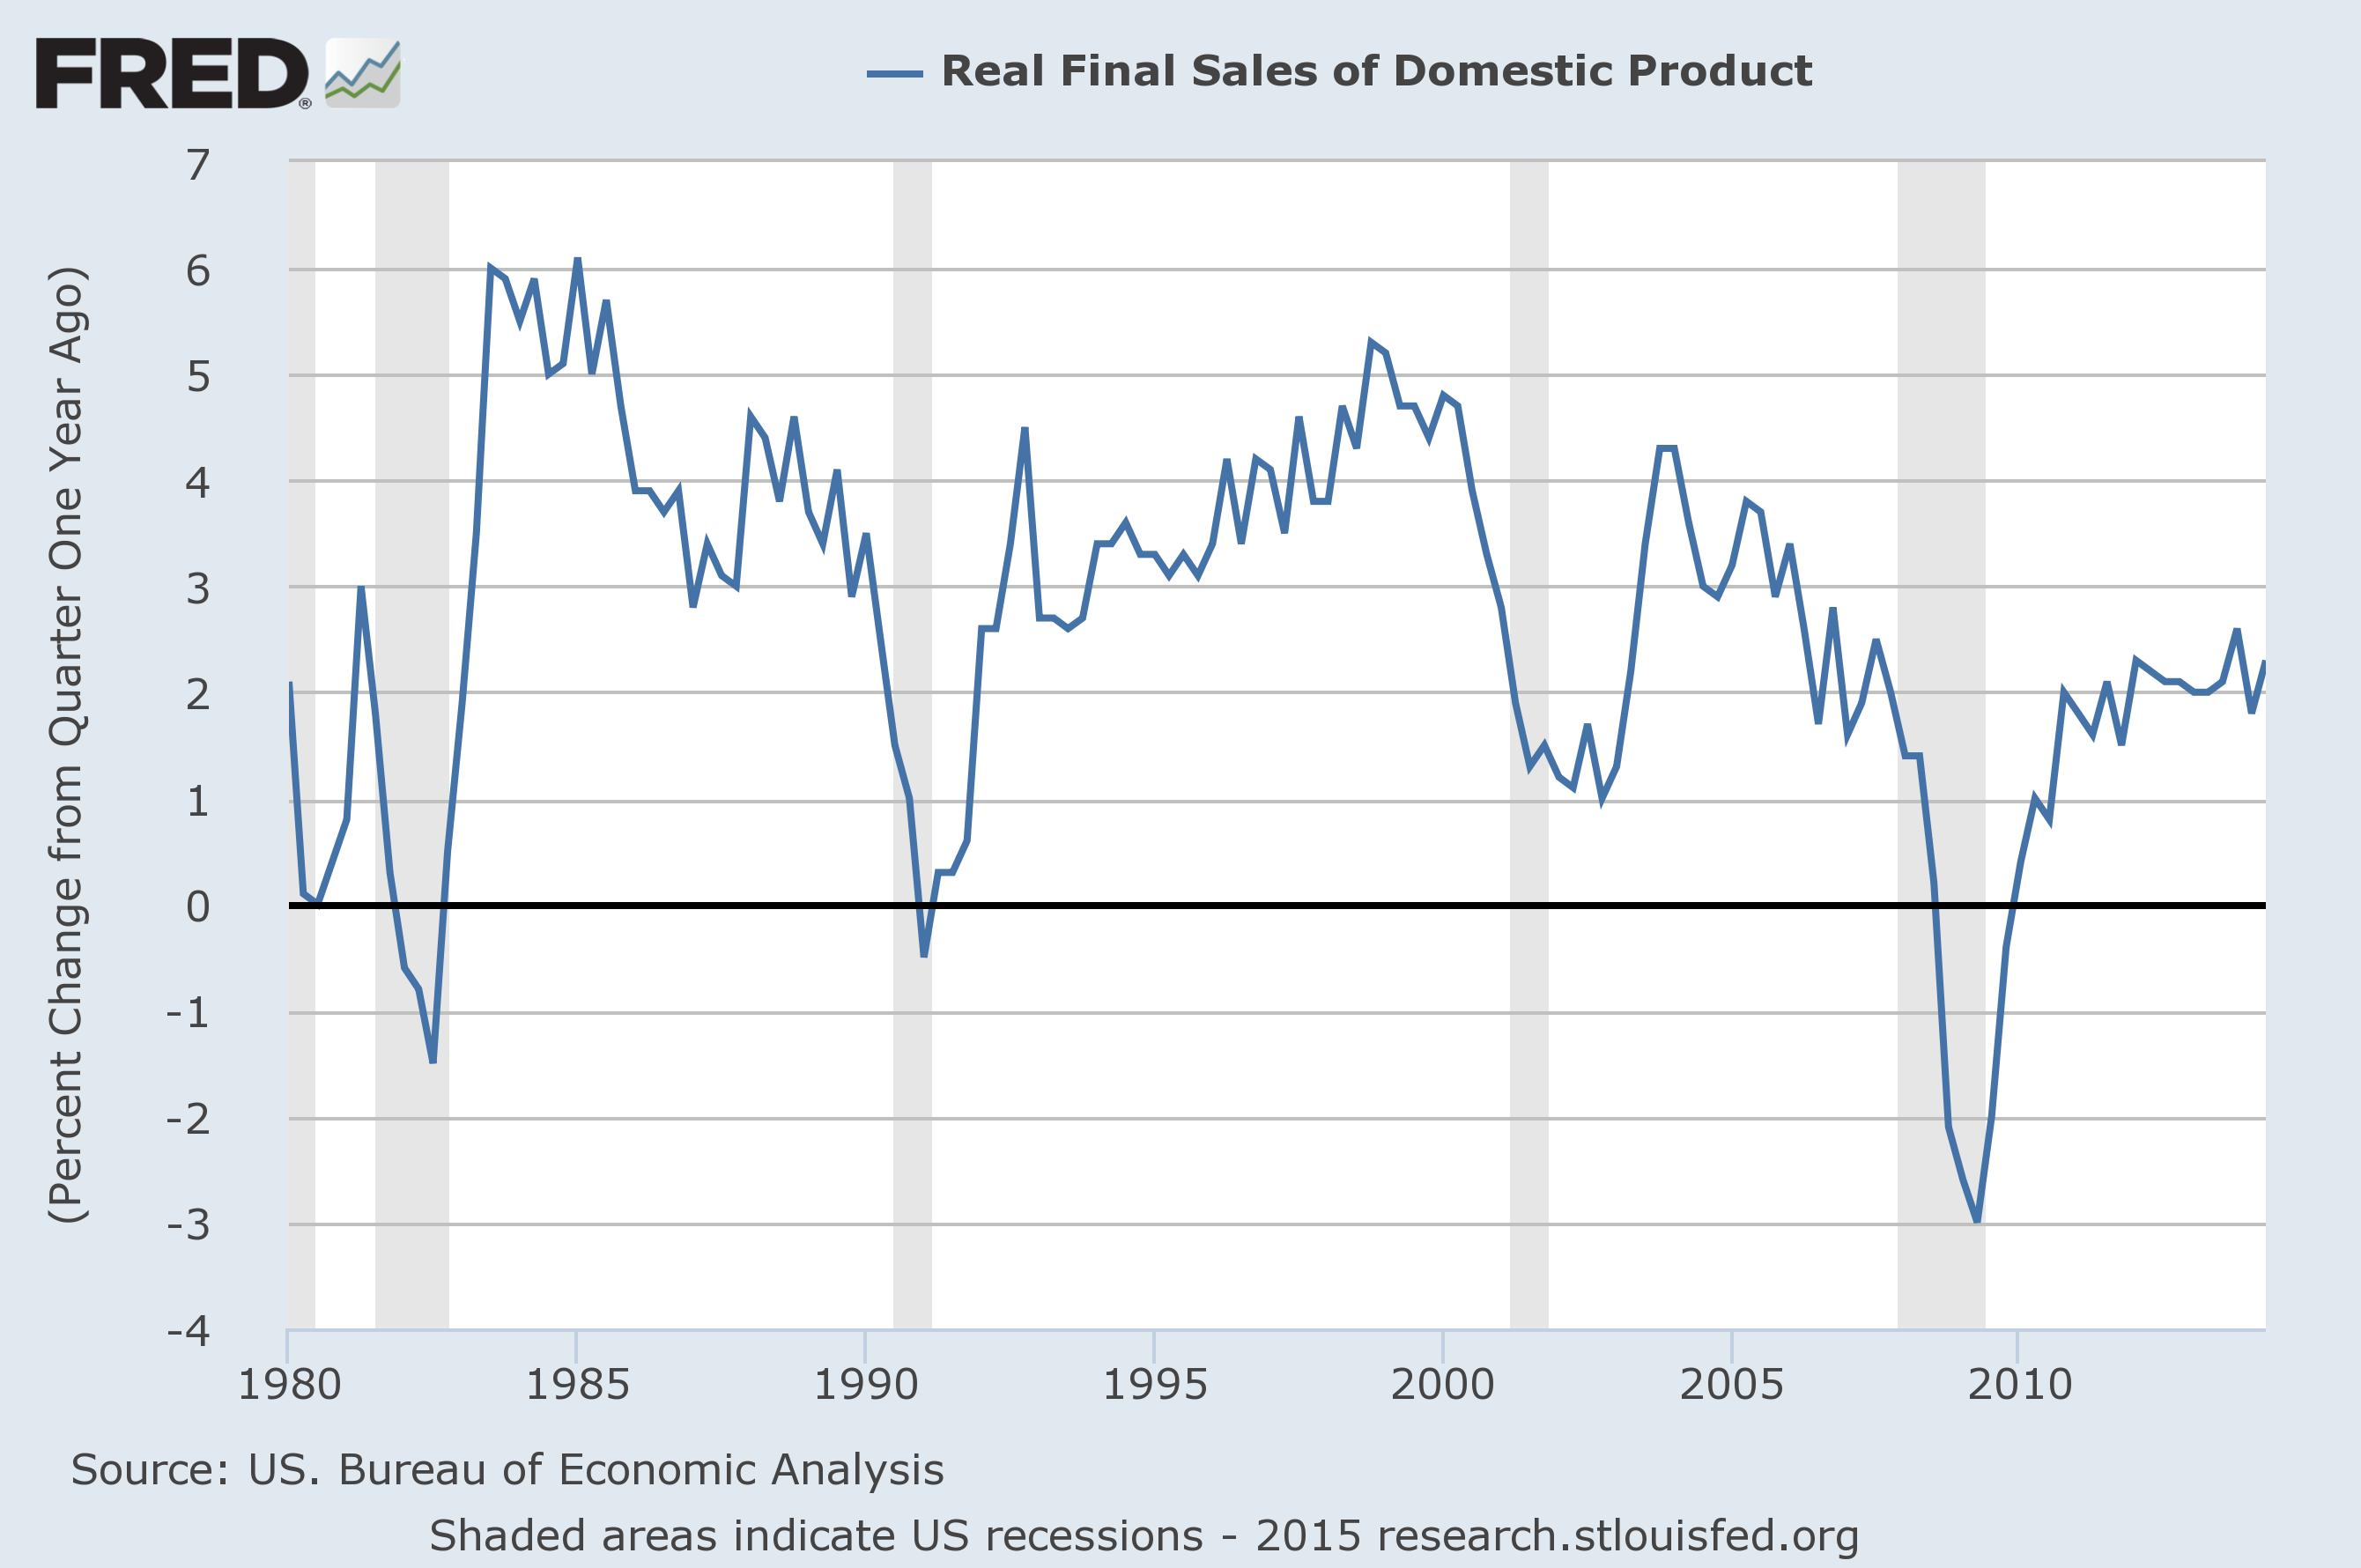
Now my mainstream economic critics will scoff at this, pointing to the recently-released Q3 GDP report, for example, as demonstrating that healthy US growth has resumed. But when you look behind the numbers at the composition, the quality of the growth, it remains poor. One way to do this is to strip out the volatile inventory cycle and see what remains of ‘core’ GDP growth, referred to as ‘real final sales’. US real final sales growth has been positive over the past few years but, notwithstanding massive policy stimulus, has barely managed to rise above 2% year-over-year. Past recoveries have seen rates two to three times higher.
‘CORE’ GDP GROWTH STUCK AROUND 2% Y/Y
If you go one step further and strip out population growth, what remains is a per-capita core growth rate of little more than zero. And what has it taken to achieve this near zero rate of per-capita growth? Why, huge government deficits which have not been spent on long-term infrastructure investment but rather programmes designed to promote current consumption. Moreover, households have been re-leveraging following a period of sharp retrenchment in 2008-9. The savings rate, averaging about 4.5% over the past few years, is only marginally higher than it was in the bubble years of 2004-7.
HOUSEHOLD LEVERAGE HAS SOARED AGAIN…

…AS THE SAVINGS RATE HAS DECLINED ANEW

There was some material deleveraging of corporate balance sheets in 2009-12 but that has now given way to re-leveraging. Much of this is occurring via share buy-backs, which were all the rage in 2014, perhaps because without them, earnings per share would not have risen by much, if at all, given now-negative US corporate profit growth.
Now this may be the first you have heard about ‘negative’ US corporate profit growth. But if you look at profits not in the ‘pro-forma’ way that corporations present them to shareholders but in how they actually report them for official pourposes according to the methodology used in the national accounts, this is precisely what you see.
CORPORATE PROFIT GROWTH NOW NEGATIVE

This is not to say that the huge monetary and fiscal stimulus in the wake of the GFC had no effect. No, it had a huge effect. But that effect was primarily to bring future consumption artificially forward and thereby to reduce the savings available to provide for investment and future consumption. Eminent Austrian Economist Ludwig von Mises famously claimed that this was akin to “burning the furniture to heat the home.” (The pernicious effects of capital consumption are discussed in greater detail here.)
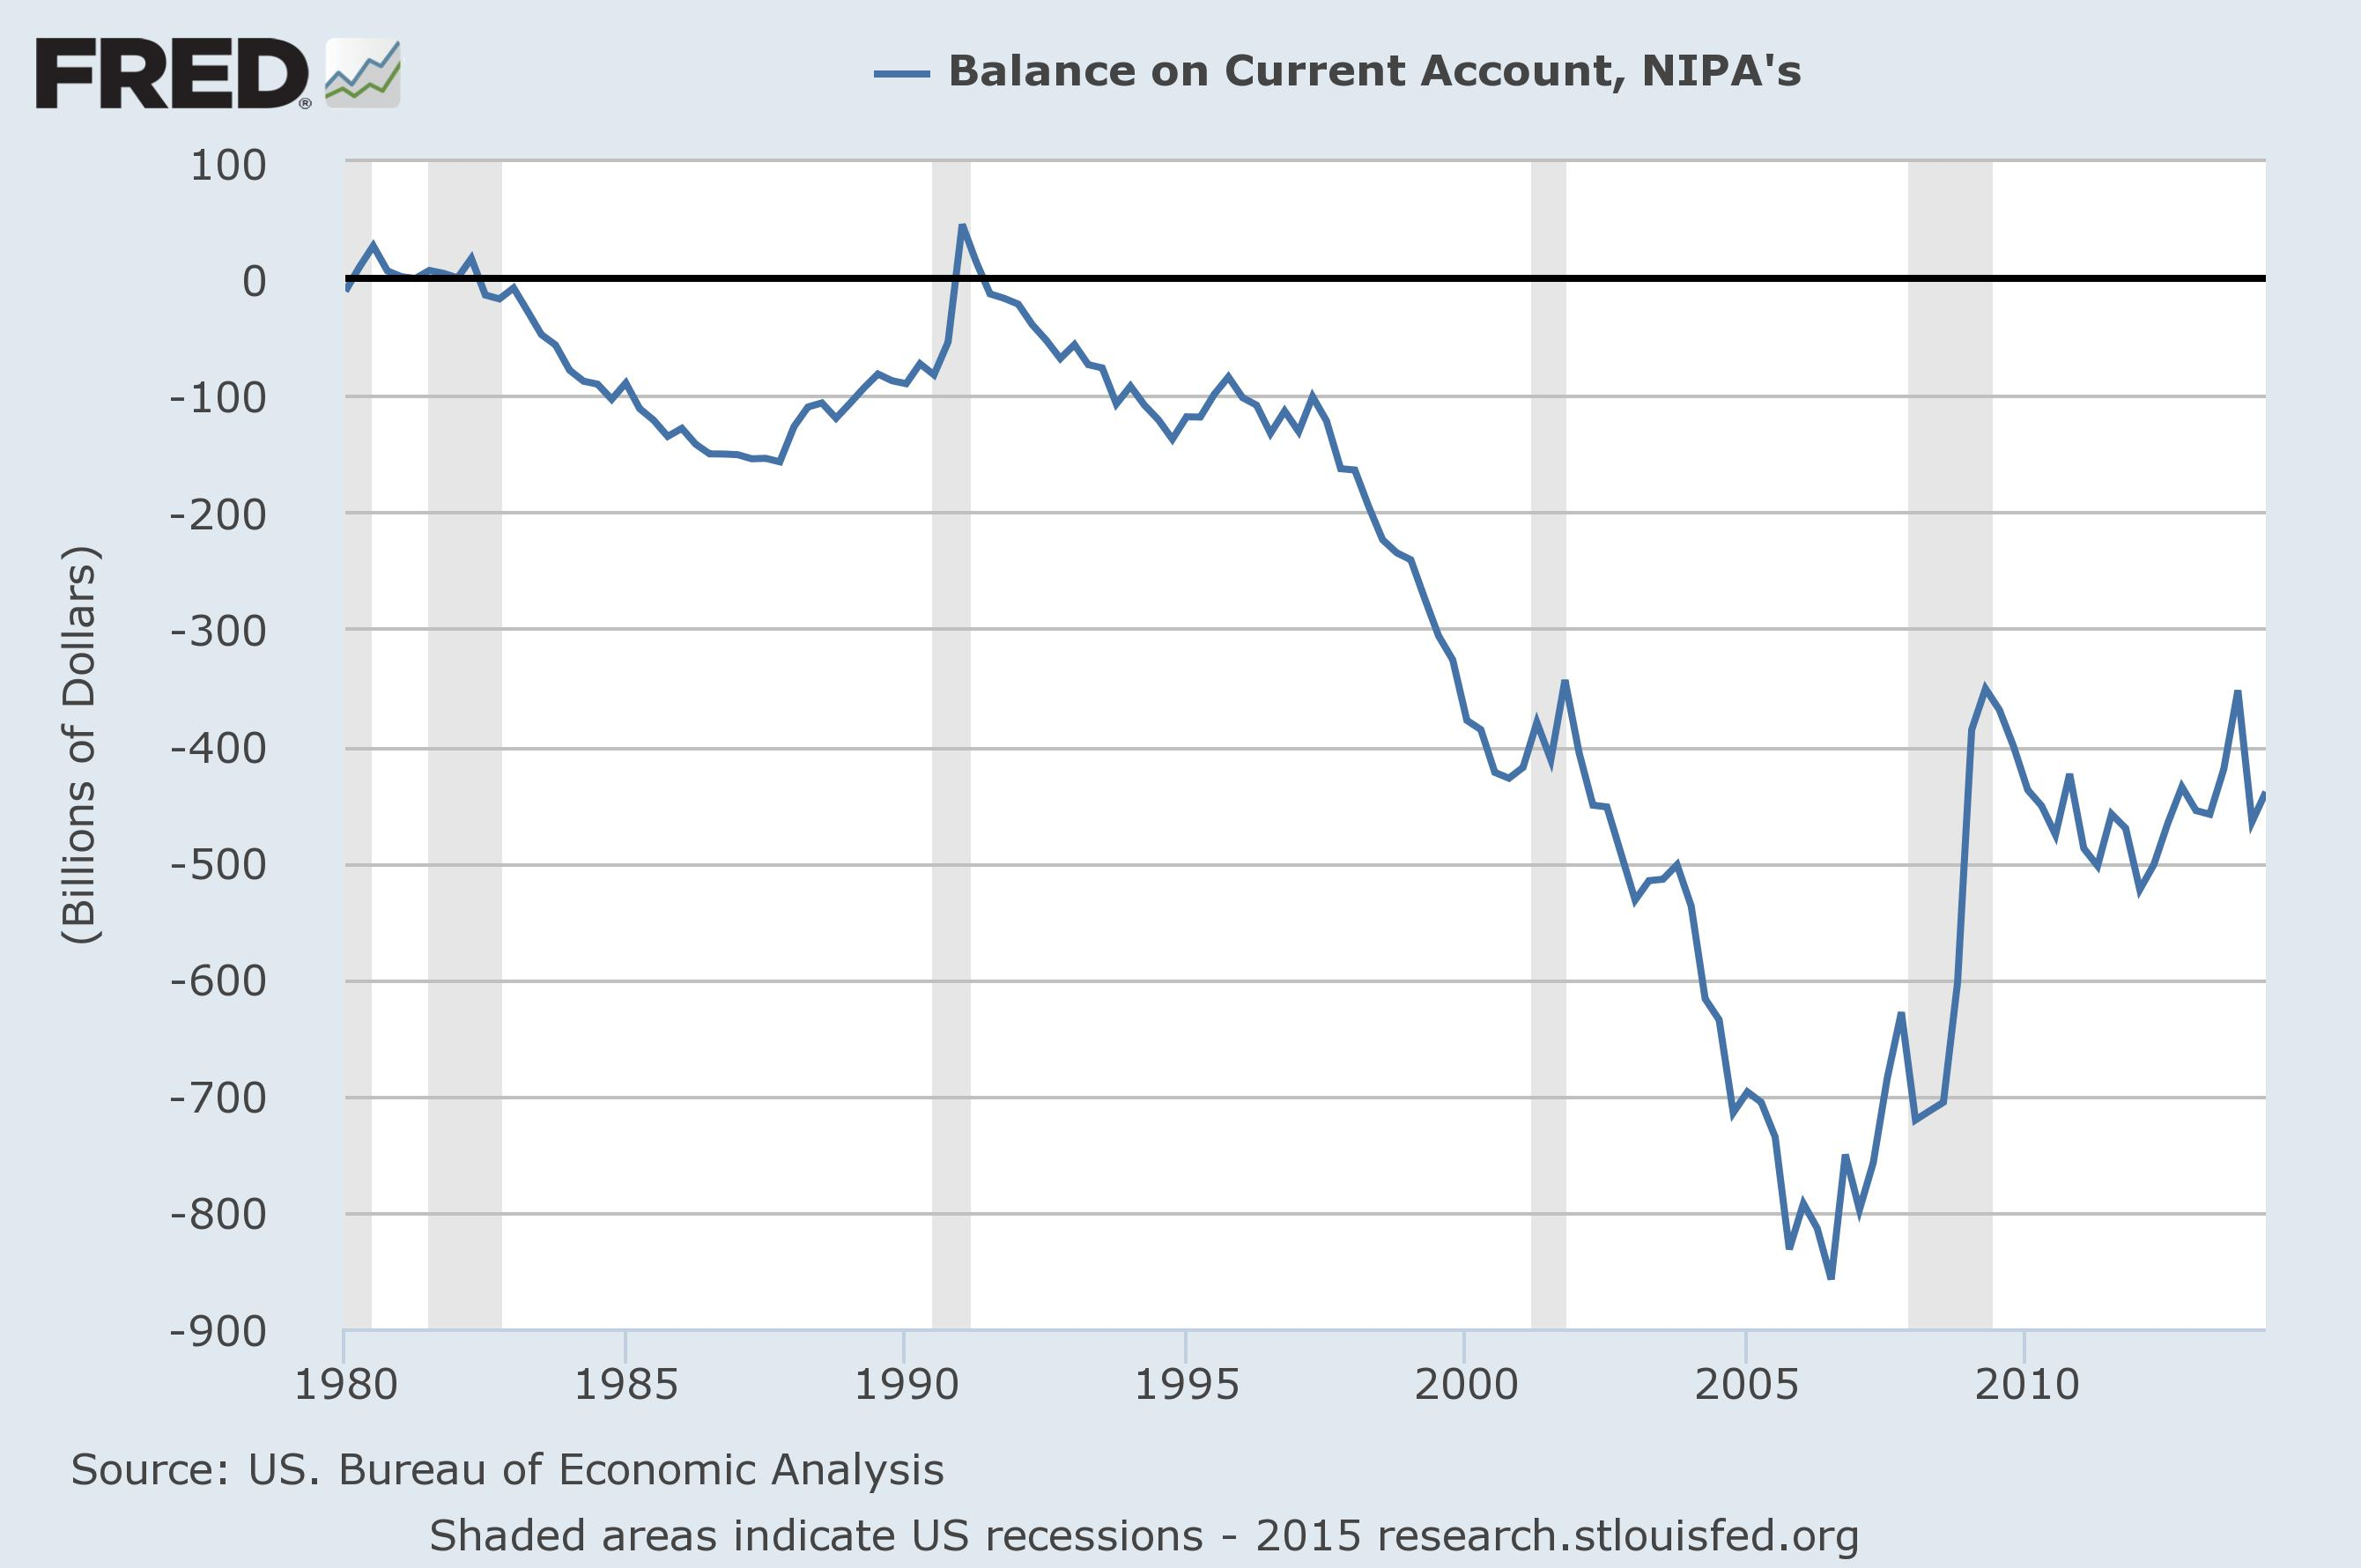
The fact is that the US is not saving enough to provide for current much less future consumption and thus must continue to borrow from the rest of the world. While the US trade deficit is not as large today as it was back in the bubble years of 2004-7—in large part due to increased domestic energy production—it remains sizeable in a historical comparison and, of course, adds to the enormous cumulative deficit that already exists.
US STILL DEPENDENT ON FOREIGN CAPITAL
So not only is US growth not on a sustainable path; to the extent there is growth, much of it is being financed with US-issued IOUs (ie dollars). The dollar may be strong at present due to flows out of various underperforming emerging markets. But this should not disguise the fact that the US economy cannot possibly decouple from the rest of the world when it is in fact highly dependent on the rest of the world as a source of financing.
DECLINING OIL PRICES ARE A KEY MECHANISM OF AN INEVITABLE RECOUPLING
Much us external financing is in the form of recycled ‘petrodollars’ from the larger oil-exporting countries such as Saudi Arabia, who take oil revenues and invest them in US assets such as Treasury bonds. This has two inter-related effects, supporting demand for the US dollar and helping to hold down US interest rates. As oil prices decline, however, so do oil revenues, in particular if global demand is declining, as it appears to be doing. This implies less recycling of petrodollars.
While in theory declining oil prices are supportive of growth, this is true only to the point that the financial system is not leveraged to oil revenues. Russia’s 1998 default on its external debt is a classic case in point. All of a sudden what appeared a benign development for the US economy was anything but, as through various financial linkages, the US financial system was in fact exposed to a sharp decline in global oil revenues.
Global liquidity, sloshing as it does from place to place, is much like the tides of the oceans. Local observers in different locations might not notice or care that a high tide in one place implies a low tide in another. But the global observer knows better: An extreme high tide in one part of the world will correspond to an extreme low tide elsewhere. But these need not occur simultaneously, as the flow from high to low between locations can take time.
Collapsing oil revenues were the proximate trigger for Russia’s 1998 decision to default on its external debt. European banks were among Russia’s primary creditors and thus they had to liquidate holdings of peripheral EU debt in order to raise capital. This pushed peripheral bond spreads sharply wider, reversing the trend in leveraged euro ‘convergence trades’ in the run-up to European monetary union. LTCM was one of the largest, most highly-leveraged followers of this strategy and found it suddenly faced huge losses potentially exceeding its capital. LTCMs creditors—primarily bulge-bracket Wall Street banks—demanded additional collateral be posted immediately. But there wasn’t enough high-quality collateral to go around and so the price of the highest-quality collateral—US Treasury bonds—soared to records in the scramble.
The Fed soon realised the scale of the potential danger: A default cascading through the heart of Wall Street. It thus placed pressure on all LTCM’s creditors to agree to a plan to ease off on collateral calls, allowing for an orderly unwind of positions. In return, the Fed would lower interest rates, to the benefit of all participants.
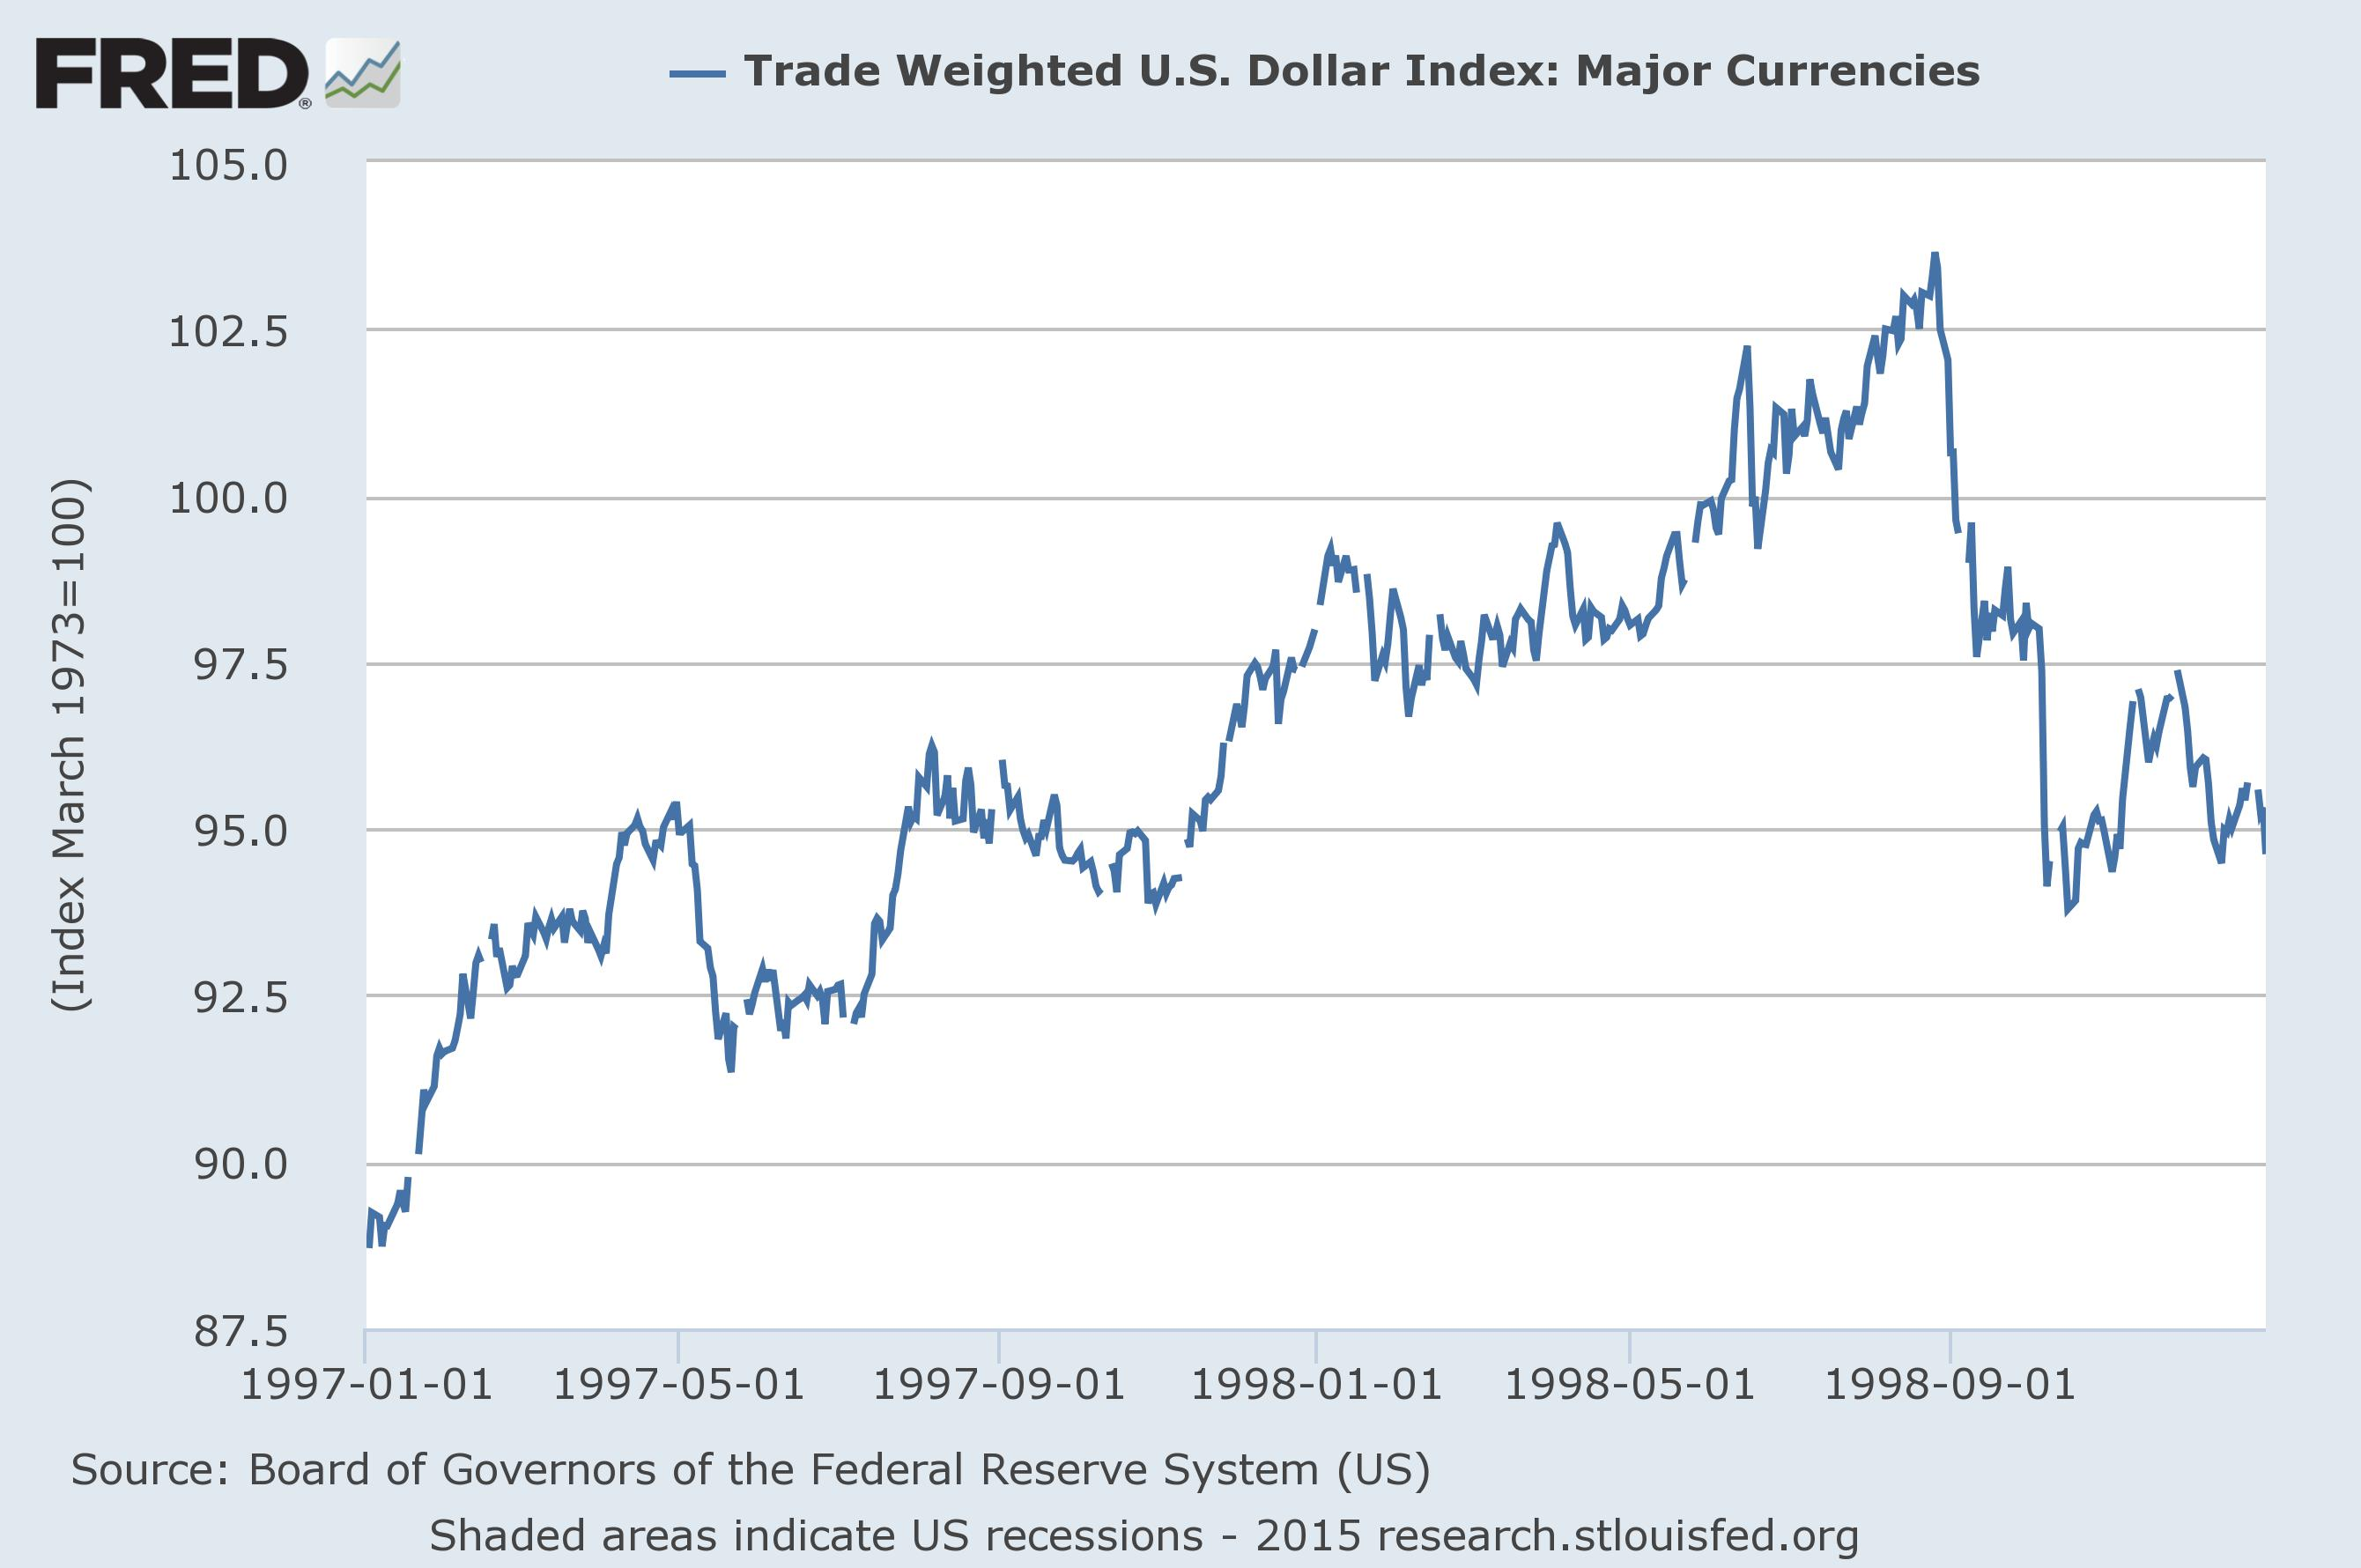
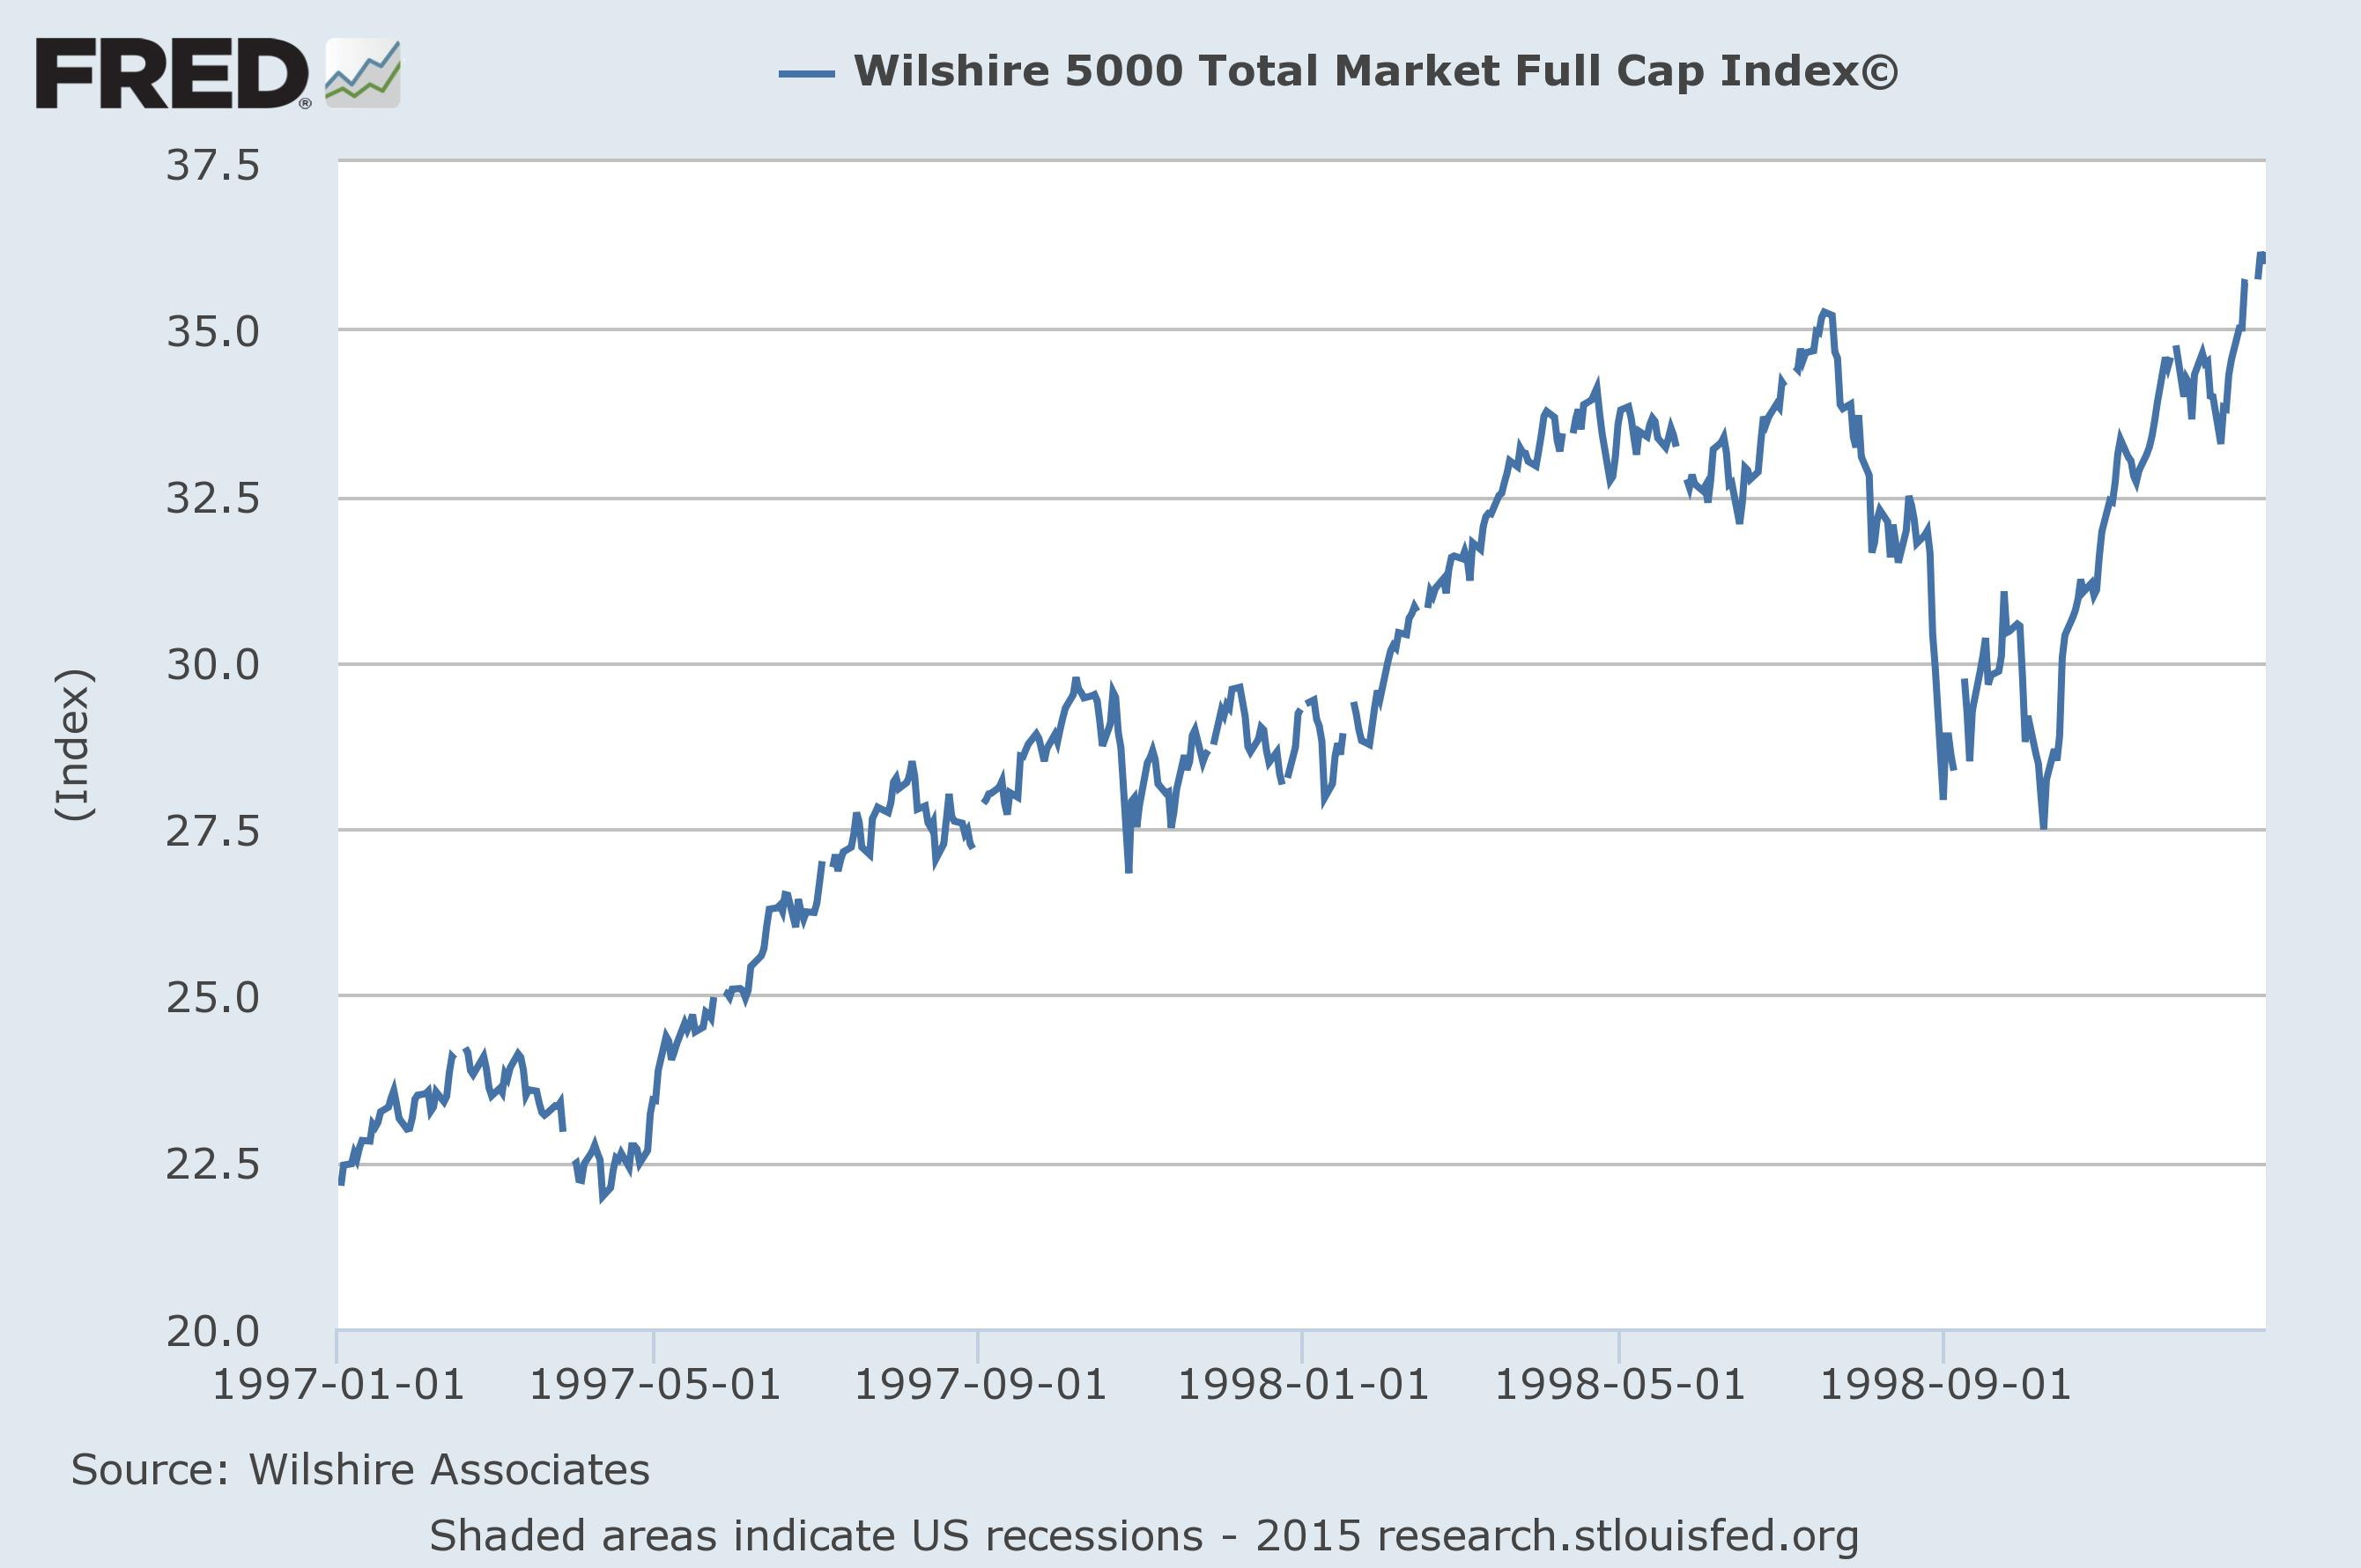
While these actions succeeded in containing the damage, they signalled to the world that the US financial system was in fact highly leveraged to the international financial markets and thus exposed indirectly to the serial crises elsewhere. Moreover, the Fed was willing to lower interest rates as required to bail out the US financial system. Hence the dollar was not the safe-haven it was previously thought to be and suddenly plunged in value, wiping out an entire year’s gains in a violent, two-week selloff.
A YEAR’S DOLLAR GAINS ERASED IN WEEKS
The US stock market also took notice, falling sharply as the re-coupling of the US to global reality set in. It was not until the Fed announced the LTCM bail out and rate cuts that the stock market began to recover.
Over the next two years, it did more than merely recover. With Fed policy actions having stimulated aggressive herd buying of equities, the NASDAQ crack-up boom took place, followed by the inevitable bust of 2001-03.
…AND A MAJOR STOCK MARKET CORRECTION
DE-CONVERGENCE HAS RUN A LONG WAY; RE-CONVERGENCE COULD OCCUR AT ANY TIME
The parallels with 1997-98 are increasingly clear. Currencies, asset markets and growth have slumped across Asia and Europe, yet US financial markets have been largely unaffected, happily continuing to climb. The dollar has strengthened steadily. Yet in the sharp decline in oil and other commodity prices we see a mechanism in motion that, in some way yet unseen, will eventually choke off the flow of liquidity into US financial markets. While I don’t anticipate that Russia will default this time round—Russia’s external government debt is tiny—there are a number of other countries out there highly dependent on commodity exports for external debt service.
Indonesia and Malaysia are two cases in point, the former being a relatively large emerging market economy. Sharp weakness in these countries’ currencies of late is an indication of growing stress eerily similar to 1997. Either or both of these countries could soon find they are unable to prevent large withdrawals of foreign capital. But devaluing a currency to deal with a balance-of-payments crisis doesn’t work as the problem is external debt denominated in a foreign currency, in this case dollars. The International Monetary Fund might try to come to the rescue, as it did in 1997-98, but the scale of the problem is far larger this time round.
Also worth mentioning here is something rather closer to home. The US shale industry is hugely dependent on leveraged financing from the US banking and shadow banking systems. (The latter uses structured financing vehicles of various kinds. By some estimates as much as a quarter of the entire US high yield debt market is related to the shale industry in some way.) With crude oil prices now plunging below $50/bbl, a huge portion of shale oil production has become unprofitable. Yet with debt to service, producers have no choice but to continue producing as much oil as they can. This will help to keep a lid on prices but will also bleed the most poorly financed producers to the point of insolvency and default, with potentially grave implications for the US financial system. (Some readers may recall the Texas oil, property and savings and loan collapse of the late 1980s, a key contributor to the eventual federal bail out of the entire US savings and loan industry.)
There are thus several ways in which today’s commodity price bust could turn into a more general financial crisis, as in 1997-98. It is impossible to know. But in my opinion, unless commodity prices soon recover, it is only a matter of time before a wave of balance-of-payment crises and/or corporate insolvences begin to dissolve the pillars of sand on which the strong dollar currently stands.
STRATEGIES FOR A DOLLAR REVERSAL
Those investors who agree that dollar strength is likely to reverse, perhaps abruptly, in 2015, should consider now those strategies that will perform well in that sort of environment.
There are various ways to speculate on a weaker dollar, the most straightforward of which is to short the dollar against other currencies in the foreign exchange markets. The difficultly with this, however, is that investors then need to take a view regarding which currencies are most likely to re-strengthen versus the dollar. Given that many countries would oppose currency strength at present, investors should take care. A diversified approach is probably best, and there are various vehicles that exist for this purpose, including the Merk currency funds. (Disclosure: Axel Merk is a personal friend I have known for many years. However I have no financial interest in his funds, nor do I receive commissions or compensation of any sort for recommending them.)
However, given that many countries might resist currency strength, the case can be made that gold has more upside potential in a dollar reversal. Moreover, if the environment turns decidedly risk-averse, as it did in 1998 for example, gold can benefit two-fold. Last year, Axel Merk launched the Merk Gold Trust (NYSE: OUNZ), a vehicle that allows for investors to take physical delivery of their gold, if desired, without this qualifying as a taxable event.
Gold’s poor sister silver is arguably better value at present, although in a risk-off environment it would be normal for gold to outperform silver. A simple diversification compromise would be to allocate 2/3 to gold and 1/3 to silver. This is because silver is normally about twice as volatile as gold. From a risk perspective, this implies an equal risk weighting in each of these two monetary metals. There are ETFs available that can be rebalanced periodically to keep holdings from drifting too far from the target 2/3 and 1/3 allocations.
Finally, a quick word on oil. While I have written above about the potentially negative financial market consequences of the recent, sharp decline in oil prices, there is of course much underlying demand for oil that is not particularly cyclical in nature but will occur even in a weak or zero-growth environment. Here I note that, even in the depths of the 2008 crisis, the oil price (WTI) found support around $40/bbl before recovering. At just under $50/bbl at time of writing, that is still a 20% decline from here, but the eventual upside recovery potential is probably far greater than 20%. For investors willing to take a risk amid what admittedly appears to be a ‘blood on the streets’ environment for oil at present, I’d recommend building a position here, either through an ETF or just by buying shares of upstream oil producers.
In relative terms, oil looks even better value, for example relative to industrial metals such as copper or aluminium. Yes, the latter have also seen prices come off but not to anywhere near the same extent. Platinum group metals may be precious but they are used overwhelmingly in industrial applications, in particular autocatalysts, and in the event that automobile demand should slow, there is much potential for these to decline relative to the price of oil. Palladium is considerably more exposed than platinum to this scenario and is thus the better short.
The really brave might even take a look at the debt of distressed shale producers, although I have no particular expertise in that area. A distressed industry is one that will likely be restructured in some way, such as by private equity firms swooping in, taking viable companies private, and restructuring them for the longer-term, out of the public spotlight.
1. There is in fact a far longer history of such interventions. In the US these include the devaluation of the US dollar by executive fiat in 1934 and abrogation of Bretton-Woods treaty obligations in 1971.