Source: 1propaganda.com
- Central banks appear more powerful than at any time in their history – has something changed?
- Not really – because of their role in government debt management and fractional reserve banking, central banks have always possessed this power
In the first part of this article I investigated the development of central banks, with a particular focus on the Bank of England. I looked at the dramatic impact the Bank had on the cost of crown/government borrowing – from an average rate of 11% in the 90 years before 1694 to 5% during the 45 years after.
In this section I will look at the impact artificially low government borrowing costs have on the value of corporate bonds and stocks. Finally I will look at the level of interest rates today – focusing on the most liquid markets for US stocks and bonds. My conclusions may disappoint but given the expediency of fractional reserve banking (1) to the governments these central banks serve, it is hardly a surprise.
The conflicted power of the central bank
To recap. Central banks have the ability to provide liquidity and set interest rates. However, their existence, at all, stems from their function as the financiers and underwriters of government borrowing. The conflicts of interest, evident in the early annals of the Bank of England described in the first part of this article, may seem less obvious today, but they still exist.
In recent times much credence has been given to the “independence” of central banks, and yet there is an inherent political conflict at the heart of their relationship with the governments for whom they act – however independent their actions appear.
In 1693 the British government borrowed £1mln at 14%. When the Bank of England was established, in July 1694, they lent £1.2mln to the government at 8%. By 1697 the government was borrowing at 6.3%. The chart below shows the evolution of the Bank Rate and Gilt Yield since 1694:-

Source: Bank of England
The spike around 1719-1720 relates to the South Sea Bubble; an early test of the omnipotence of central banks. If a similar bubble burst today I would expect bond yields to be driven lower rather than higher, but there are signs, as I mentioned in this article – Is the “flight to quality” effect breaking down? that the duration of bond portfolios has increased so dramatically that bonds are no longer quite the safe haven they once were.
With government debt to GDP hitting 260% by 1819 it seems extraordinary that they should be able to borrow for as little as 5% to 6%. During a similar period of high debt (1560’s) even the brilliant Sir Thomas Gresham only managed to bring the cost of borrowing, for Elizabeth I, down from 14% to 12% – though his upward manipulation of Sterling on the foreign exchanges proved a greater success. It marked the only decline in the price level during the great inflation of the 14th century.
Perhaps my comparison with the Elizabethan era is unfair. Prices rose 22% between 1600 and 1690 whilst they fell by 4% between 1690 and 1740, but a, more than, halving of the cost of government borrowing cannot be ascribed solely to mild deflation and a reduction of financial frictions. North and Weingast – The Evolution of Institutions Governing Public Choice in 17th Century England – make a valiant case to the contrary, pointing to the increase in lending by Child’s Bank as an example of capital deepening:-
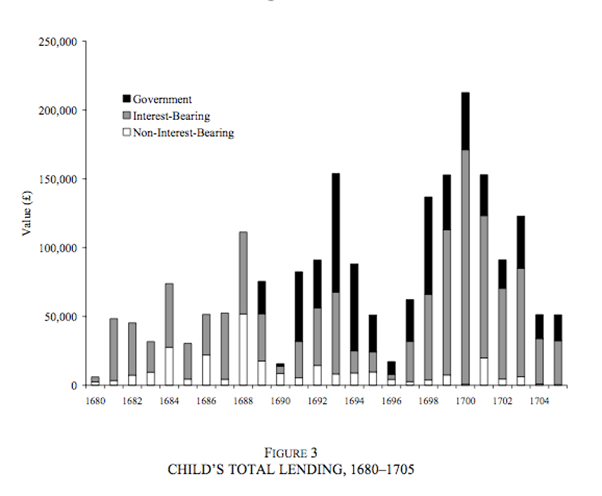
Source: North and Weingast
As the tables below, which I also commented on in part 1 of this article, make clear, I believe it is the questionable ethics of fractional reserve banking (1) – with those reserve requirements governed by central banks – which contrived to drive government borrowing rates below the “natural rate” of interest:-
| Year | Borrower | Rate | Notes | Loans | Mortgages | Rental yield | Usury Maximum |
| 1604-1605 | James I | 10% | from the Fishmongers | 7.74% | 5% | 6.07% | 10%* |
| 1611-1612 | James I | 10% | Secured by duties | 7.86% | 5% | 5.85% | 10% |
| 1617 | James I | 10% | Secured by bond | 7.86% | 5% | 5.85% | 10% |
| 1625 | Charles I | 8% | Secured by Crown revenues | 7% | 5% | 6.26% | 8% |
| 1640 | Charles I | 8% | Usual Rate | 6.74% | 5% | 5.78% | 8% |
| 1660-1670 | Charles II | 8% | 5.47% | 4% | 5.40% | 6% | |
| 1665 | Charles II | 8-10% | Secured by taxes | 4% | 4% | 5.40% | 6% |
| 1660-1685 | Charles II | 10-20% | 5.55% | 4% | 5.38% | 6% | |
| 1680 | Charles II | 6% | Secured by revenue | 5% | 5% | 5.30% | 6% |
| 1690 | William III | 10-12% | Secured by revenue | 5.26% | 5% | 5.00% | 6% |
| 1690 | William III | 25-30% | Unsecured | 5.26% | 5% | 5.00% | 6% |
| 1692 | Government | 10% | First Issue | 5.26% | 5% | 5.00% | 6% |
| 1693 | Government | 14% | Second issue | 5.26% | 5% | 5.00% | 6% |
| 1694 | Government | 8% | BoE loan secured by duties | 5.26% | 5% | 5.00% | 6% |
| 1697 | Government | 6.30% | Secured by Excise duties | 5.26% | 5% | 5.00% | 6% |
| 1698 | Government | 8% | Secured by Excise duties | 5.26% | 5% | 5.00% | 6% |
| 1707 | Government | 5% | Secured by Crown revenues | 5% | 5% | 4.94% | 6% |
| 1728 | Government | 4% | Secured by Coal duty | 4.86% | 5% | 4.39% | 5% |
| 1731 | Government | 3% | Secured by Excise duties | 4.67% | 5% | 4.07% | 5% |
| 1739 | Government | 3% | Sinking Fund | 4.67% | 5% | 4.07% | 5% |
* Henry VIII introduced the first maximum rate in 1545.The Usury law was finally repealed in 1854.
Source: A History of Interest Rates – Sidney Homer, Richard Eugene Syllaand, English Institutional Evolution – North and Weingart, The Agricultural Revolution and the Industrial Revolution:England, 1500-1912 – Gregory Clark, University of California, Crown revenue and the political culture of early Stuart England – Simon Mark Healy (Birkbeck)
| Year | Gov-Loan | Gov-Rent | Gov-Mort | Loans | Rental | Mortgage |
| 1604-1693 | 5.19% | 5.75% | 6.46% | 6.05% | 5.48% | 5% |
| 1694-1739 | 0.33% | 0.31% | 0.33% | 4.95% | 4.64% | 5% |
Source: A History of Interest Rates – Sidney Homer, Richard Eugene Syllaand, English Institutional Evolution – North and Weingart, The Agricultural Revolution and the Industrial Revolution:England, 1500-1912 – Gregory Clark, University of California, Crown revenue and the political culture of early Stuart England – Simon Mark Healy (Birkbeck)
The chart below shows the evolution of UK government debt as a percentage of GDP since 1692:-
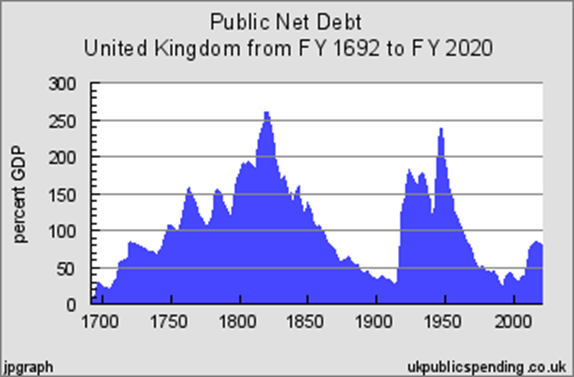
Source: ukpublicspending.co.uk, jpgraph
Government borrowing is often referred to as deferred taxation – taxes must be raised at a future date to repay today’s borrowing. For a different perspective on this idea – Ralph Musgrave – National debt is not deferred tax is worth perusing. Inflation is, of course, the borrower’s friend in this regard, however, by artificially lowering the cost of government borrowing, through the power of fractional reserve banking, the government is also able to service a larger proportion of debt relative to GDP – or, at least, future tax receipts. What is not seen, is that this borrowing crowds other potential borrowers out of the market, curtailing their ability to invest. Notwithstanding arguments about whether governments are equipped to allocate capital efficiently, the rate of economic growth suffers by the degree to which government borrowing is for the purpose of general expenditure rather than capital investment.
How do interest rates effect stock valuations?
In the days of the Gold Standard, central banks were constrained in their ability to reduce interest rates, excessively, by the need to offer specie on demand. Once currencies became issued by fiat – unshackled from any measure of value beyond market perception – central banks could keep interest rates lower for longer. Whilst artificially low interest rates might be good for an economy, as a counter-cyclical measure to mitigate the vicissitudes of a recession, if adopted in the long run, it distorts the price of money. This, in turn, leads to malinvestment.
This might seem incendiary but, let us assume that the rate of interest at which the UK government has been able to borrow is a mere 300bp below the rate it should have been for the last 322 years – around 4% rather than 7%. What does this mean for corporate financing?
There are two forces at work: a lower than “natural” risk free rate, which should make it possible for corporates to borrow more cheaply than under unfettered conditions. They can take on new projects which would be unprofitable under normal conditions, artificially prolonging economic booms. The other effect is to allow the government to crowd out private sector borrowing, especially during economic downturns, where government borrowing increases at the same time that corporate profitability suffers. The impact on corporate interest rates of these two effects is, to some extent, self-negating. In the long run, excessive government borrowing permanently reduces the economic capacity of the country, by the degree to which government investment is less economically productive than private investment. Policies differ but, as the chart below shows, when government borrowing exceeds 15% of GDP the potential growth rate of the economy begins to suffer:-
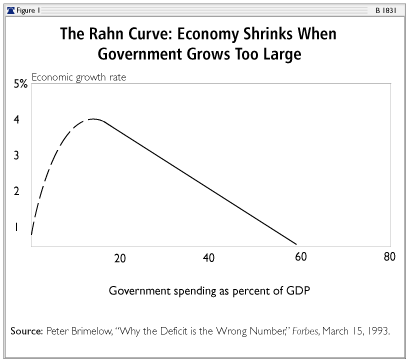
Source: The Heritage Foundation, Peter Brimelow
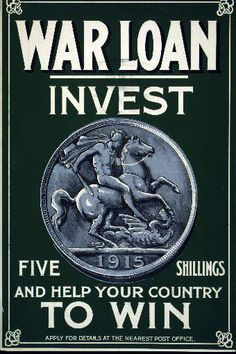
The reality is that investors’ memories of default risk are short and the British government has managed to avoid default – although it did reduce the coupon on War Loan (see the poster above) to 3.5% in 1932. The same year that it defaulted on, or perhaps I should say, was forgiven, its inter-allied debt to the USA at the Lausanne Conference.
The effect on stock prices is dramatic. If the interest rate on borrowings, from bank overdrafts to bond issues, is artificially low, but the cost of corporate borrowing is likely to increase during an economic downturn, or as government interest rates increase, then the policy of the central bank – in relation to both short term and long term interest rates – becomes substantially more important to the valuation of a stock, than it would be in a unfettered market.
Comparing US stocks and bonds
During much of the period since 1971, the artificial lowering of interest rates has been obscured by inflation. As inflation rates rose, so the traditional relationship between stock dividend yields and government bond yields inverted. The chart below shows the S&P500 dividend yield (in red) and 10yr US Treasury yield from 1871 to 2011. During the majority of the period the dividend yield was higher than the bond yield. This is consistent with the concept that there should be a risk premium required to invest in stocks rather than bonds. During the high inflation era, the relationship inverted, because stocks provided a natural inflation hedge, while bonds did not:-

Source: Global Financial Data Inc.
The average dividend premium for owning stocks between 1871 and 1957 was 1.83%. Today the dividend yield premium is +0.41%. The table below shows the average dividend yield (DY) bond yield (BY) and the spread for the pre and post inflation era:-
| Period | DY | BY | Spread |
| 1871-1957 | 5.34 | 3.51 | 1.83 |
| 1958-2010 | 3.11 | 6.53 | -3.42 |
Source: Multpl.com
After several generations in which stocks acted as an inflation hedge – not to mention those corporate executives, incentivised by receipt of copious share options – the dividend yield is still unsurprisingly low; this may, of course, be driven by a more generalised yield compression. As government bond yields reached all-time lows, so the risk premium demanded by investors, to switch into corporate bonds, has fallen and this in turn may be depressing dividend yields. A 10yr US Treasury bond returns 1.65%, less than half its long-run average. Corporate bonds and even stocks are, therefore, far more sensitive to changes in central bank and government bond rates today than at any time in the last 145 years.
Conclusions
While stock valuation measures, such as dividend cover and price to earnings per share, remain valid, their impact is dwarfed by the effect of interest rates. Ever since the dawn of central banking, the “risk free” interest rate has been artificially low. This has been especially true during periods of fiat issuance, when convertibility of the currency has been suspended.
A normalisation of interest rates does not appear imminent, which is supportive for stocks, but it would be wise, from a defensive perspective, to look for corporate stocks, with good fundamentals, which can offer higher dividend yields. The trend rate of global economic growth has been slowing, inflation generally remains subdued and the quest for yield is not diminishing.
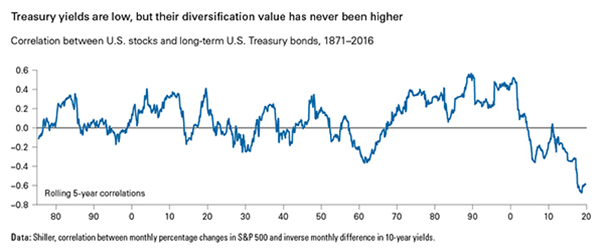
And yet, the rolling five correlation between stocks and bonds is at its lowest in more than 145 years, as the chart below shows:-
Source: Robert Shiller – Yale University
Do not be deceived by daily correlation data – with the absolute level of bond yields at less than half its long run average, it is the bond market which will determine the direction of stocks. As bond yields climb, which, in the US, is currently driven by expectations of Federal Reserve (Fed) tightening, stock markets will fall. The decline in stocks then prompts expectations of a delay to Fed tightening and the stock market recovers. The daily five year rolling correlation between stocks and bonds may be at its most negative on record but annual correlations are still strongly positive. Portfolio managers, of course, extol the, volatility dampening, virtues of portfolio diversification, but, when bonds yield 1.65% and dividends 2.06%, it is cold comfort to pension fund investors. Calpers still clings to a 7.5% annual return target – last year it managed to deliver 2.4%.
Security Analysis, as Graham and Dodd’s 1934 book was entitled, still has a place and, in the “great unravelling” which is likely to arrive once all monetary and fiscal policies have been exhausted, it likely to prove the safest tool to navigate uncharted waters. For the present, however, central banks and developed nation governments still have plenty of tools available to deploy. The artificially low price of money will continue to dominate markets for bonds, currencies, real-estate and even stocks for some time to come.
Notes:
- Fractional reserve lending or banking is a system in which only a fraction of a bank or lenders deposits are backed by actual cash on hand.
Additional sources:
Nicholas Mayhew – Sterling (1999) Allen Lane
Phelps, Brown and Hopkins – Economica Vol 22 No 93 (1956)
Rondo Cameron – A Concise Economic History of the World – 3rd Edition (1997) OUP



It’s hard to be sure exactly what the overall effect of central banks and government borrowing is on interest rates. The really big elephant in the room is government borrowing: that normally dwarfs central bank balance sheets. Certainly governments shouldn’t borrow to cover CURRENT spending. As to whether they should borrow to fund CAPITAL spending, it’s commonly supposed they should. However the arguments for that are actually very questionable.
Milton Friedman and Warren Mosler favour/ed “zero government borrowing”. My hunch is that they are right, thus my hunch is that the net effect of central banks and governments is normally to boost interest rates.
RM. Do you mean ‘boost interest rates’ elsewhere in the market? As in out-compete?
Excellent.
The logic of the piece supports what one would suspect from observation and experience.
For the life of me I cannot understand why anyone ‘trusts’ Governments and Central Banks seeing as how they are both ultimately funded by coercion on the people they borrow from. Essentially the Government has no ‘credit’.
On that basis you’d expect a premium for lending to government, not a discount over creditworthy private borrowers.