Much ink has been spilled (and some even coherently applied) over the vexed subject of ‘deleveraging’ and its likely impact upon the economy-at-large.
For the Keynesian-tainted mainstream, this all comes down, of course, to the fear that individuals and businesses – having succumbed to the illusion that they should expect to enjoy a higher standard of living than their productive capacities could support – might rediscover the Micawberish happiness of living within their incomes and that aggregate spending (and with it prices!) might temporarily fall, while people again found a way to earn what they had formerly charged copiously to their plastic.
In order to avoid this supposed societal evil, Leviathan has been roused from his fitful slumbers to stride forth and do our spending for us on a truly epic scale, while we have been indoctrinated to believe that we would all become instantly richer if only we would respond more eagerly to the Counterfeiter-in-Chief’s valiant efforts to debase the value of what little money we have yet managed to hold on to.
Since the LEH-AIG implosion, household debt has incontrovertibly shrunk, falling some $466bln as mortgage borrowing outstanding (which had run at a scorching 11.9% compounded rate in the seven fat years to end-2007) dropped by $423bln.
To view this as a return to voluntary thrift, however, is a little premature since, for example, the 6% decline in consumer credit extant almost exactly matches the average 5.6% bank charge-off rate for such lending. On the residential side, banking write-downs of a mean 2.3% have so far amounted to around $100bln according to the FDIC – with another $30bln or so to add in on Fannie & Freddie’s account.
But that is not quite the end of the picture for, if we combine the MBA’s quarterly assessment with the Fed’s FOF numbers, we can estimate that the stock of mortgages subject to foreclosure has swollen by around $165bln in this period, with $300bln more having also become delinquent – and this without taking account of multi-residential property, second-liens, or RE now perforce owned by the lenders.
A further indication of the scale of the distress can be seen in the fact that whereas foreclosure usually takes place within 180 days of a loan falling past due, the current average is a mind-boggling 470 days, implying that lenders have been falling over themselves not to recognise the true state of affairs for as long as they could ‘extend and pretend’.
This is no laughing matter, as commercial banks with assets between $100mln and $1bln – of whom there are some 3,800 with a combined $1tln balance sheet – have OREO-inclusive ‘Texas Ratios’ of 32%, a number as bad as all but the worst seen during the late-80s bust. Moreover, they have an average exposure to real estate loans of no less than 525%, a figure which perhaps explains their reluctance to further depress property prices by turning payment-shy mortgagees out into the street.

Far less equivocal, however, has been the behaviour of Corporate America, for here there was a decisive move to preserve cash flow – and, more importantly, to boost free cash flow. The cynic will note that this even went so far as to leave enough in the bank to pay dividends (for only the second spell in twenty years) and that there were even two quarters of next domestic equity issuance and credit reduction, a far cry indeed from the record net $375 billion ($310bln ex-FDI) doled out to shareholders and high executives on the eve of the storm, in QIV’2007.
If we put all this together, we find that, in the face of an estimated 15% fall in sales, and a 43% drop in gross income, free cash flow was actually increased steadily from its pre-crisis lows over the winter of 2007-2008 to hit record levels last summer (see below for Fig 1 ).
This was achieved through a drastic pruning of outlays of a rolling 4Q, peak-to-trough magnitude of 32% in below-the-line outlays, consisting of a 20% reduction in fixed capital spending and a chart-topping $137bln slashing of inventory. Reinforcing this, payroll outlays were cut by almost 6%, equivalent to a $250bln a year saving.
While dividend payments were largely maintained intact, equity issuance net of FDI receipts swung from a balance sheet-sapping, ESOP-mainlining $500bln buyback to a $78bln net call on the domestic market. As a consequence, borrowing actually went down modestly in the second half of last year, having hit a peak of $430bln in the summer of 2007 as the first Fed rate cuts led to some very unwise, late-cycle financial engineering.
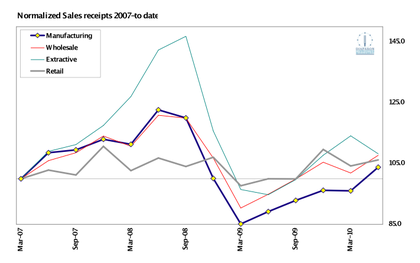
Of course, this dramatic pullback in corporate discretionary spending has sent shockwaves travelling the productive structure in a manner that the Herd, with its dull obsession with retail outlays, never manages fully to comprehend. In typical fashion, the pain has been focused on the higher order sectors, as well as on those most directly linked to credit-fuelled, exhaustive spending on houses and cars, as the following schematic of normalized sales reveals (Fig.2).
As such, here is where the Bust has wrought its havoc but – at the risk of appearing hard-hearted – this has been a necessary (if not yet sufficient) precondition of the recovery. Dangerous levels of leverage could not have been allowed to mount further; budgets simply had to be recast in order to take account of the post-Boom landscape and new priorities had to be set, accordingly.

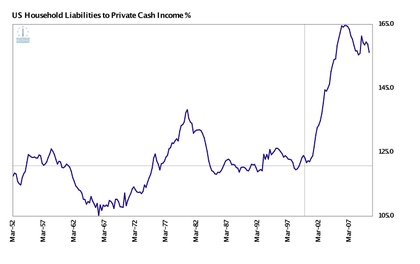
The darker side to this, however, is that little actual ‘deleveraging’ has occurred (outside of the rather more badly impaired non-corporate sector, that is). Indeed, for all the cash accumulated, debt levels still remain very high by historical standards, both as a proportion of net worth and in relation to income.

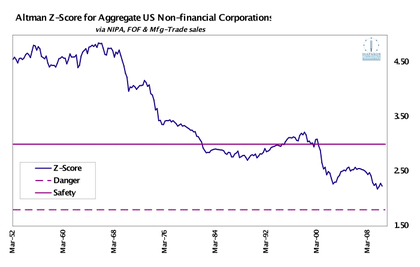
All of which means that, on the aggregate, there has been almost no improvement in average creditworthiness, as evidenced by the composite Altman Z-score estimate for the sector as a whole.

If we once remember that the aggregate hides some wider, individual distribution, it is clear that Ben Graham’s ‘margin of safety’ has been severely pruned in the inflationary finance era ushered when even the pretence of a link to gold was abandoned with the collapse of Bretton Woods.
Arguably then, whatever the Inflationists continue to advocate, more repairs need to be effected to balance sheets, not fewer, and, No!, Mr. Wolf, this does not mean someone else must become a net borrower in order to achieve this; simply that people and companies have to accept a settlement of the past debts owed them.
Your lowered net liabilities can just as easily (and more healthily) be reflected in my lowered net financial assets, not just in my equal-and-opposite increase in the use of credit.
If you previously bought more of my produce than you could pay for, I had to accept your IOU for the difference. Now that you wish to lower your outstanding obligations, I do not have to borrow in your place, but I do have to let you deliver me goods or services to the value of the original loan (or steel myself to a partial write-off of it). Strictly speaking, this does not even impose the necessity of you consuming less or me cutting back production: if you increase your marketable output sufficiently, you can both pay for another consignment of my wares and extinguish your existing liability – after all, is this not the very thing we hope for from all those businesses on which we acquire claims?
Rather than facilitating this, sadly, the State is blindly violating its duty to provide for the greater good by further impairing our balance sheets (since we are the ones who will eventually have to foot the bill for its opposition to our wishes) faster than we are able to mend them.

Government, indeed, is more than compensating for private credit contraction. Revealing as it is, what the chart above does not flesh out is that there has been substantial Federal borrowing in order to lend, not just to spend – with around $85bln in new loans (some to state & local government), $225bln in GSE support, $50bln in equity acquisitions, and $130bln in student credit since 2007 – so a gross debt contraction, in blunt Keynesian aggregate terms, is not actually being allowed to take place.
The problem with this is that while corporates are trying to heal themselves, they are also painfully aware that (a) the previous overspend (whose dubious fruits they so enjoyed) is not likely to return rapidly; and (b) that this governmental excess will eventually come out of their, or their patrons’, pockets.
Here we are subject to the suspicion that government deficits, being unitary, are much more visible – and, of course, can be dealt with more arbitrarily – than the sum of a myriad private ones and hence excite much more angst. There is no debt clock running to add up the other sectors’ improvidence, as there is with Leviathan.
Thus, while companies wait to find out what they or their customers will have to suffer in terms of carbon gabelles, trade restrictions, health-care levies, and all manner of taxes, they are still somewhat loath to put this free cash to work in the form of laying down fixed, specific, physical capital or in taking on more long-term labour commitments, hence the heretofore anaemic nature of the recovery. And now we are in the process of adding a further layer of currency and interest rate uncertainty to the mortar, the wall of disincentives can only tower ever higher above us all.

